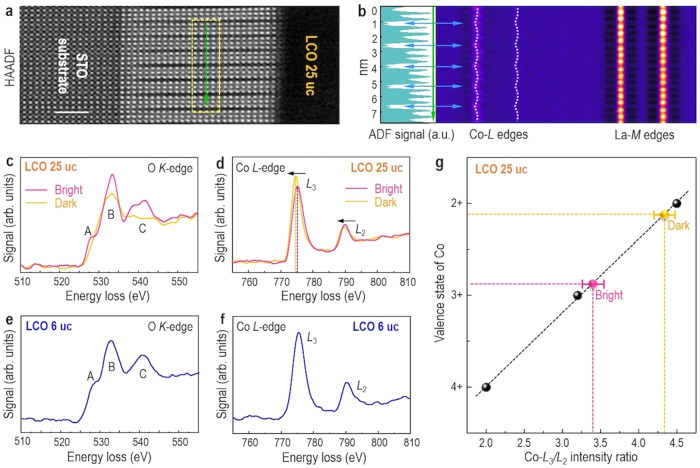
Fig. 2. EELS fine structures of LCO films.
a Z-contrast HAADF-STEM image of LCO 25 uc in cross-sectional orientation, projected along the [010] zone axis. Scale bar: 2 nm. b The second derivative of the EELS line-scan along the green arrow direction, highlighting the variation of the peak position of Co-L2,3 edges. O K-edge EELS spectra of c LCO 25 uc and e LCO 6 uc. Co L2,3-edge EELS spectra of d LCO 25 uc and f LCO 6 uc. g Calculated Co L3/L2 intensity ratios and corresponding valence states of Co for the bright and dark stripes in comparison to literature values of Co2+, Co3+, and Co4+ 27,28 (black points).

