Figure 1.
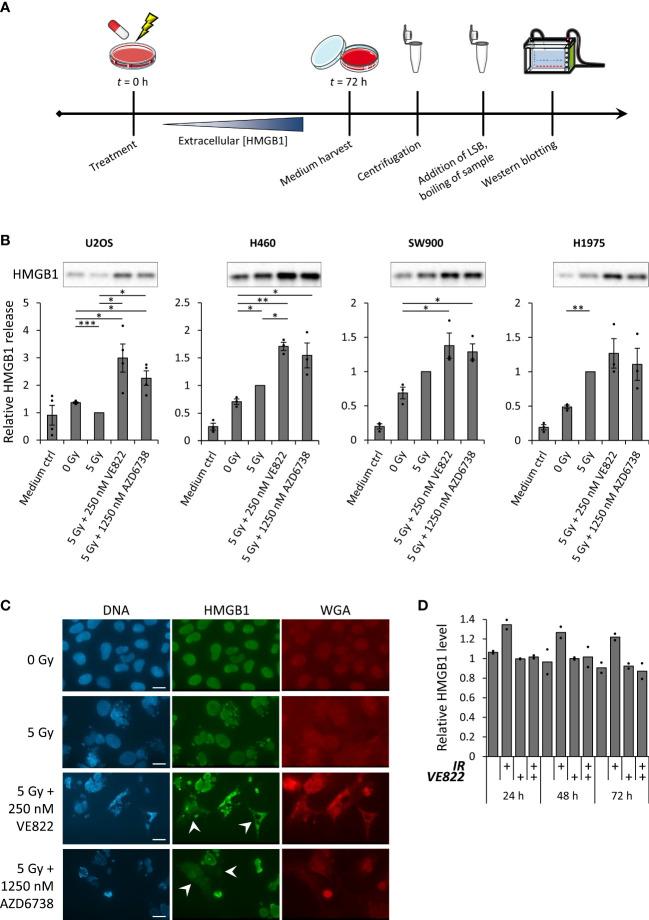
Combined treatment with radiation and ATR inhibitors translocate HMGB1 from the nucleus to the cytoplasm, and increase radiation-induced extracellular HMGB1 release. (A) Experimental set-up for measurement of HMGB1 release. Medium from treated cells was collected 72 hours post treatment to allow for accumulation of extracellular HMGB1. After harvest, the samples were centrifuged in order to exclude floating cells, before they were diluted in loading sample buffer (LSB) and analyzed by SDS-PAGE and western blotting. (B) Results from three or more experiments performed as in (A) for U2OS, H460, SW900 and H1975 cells. Bar charts show quantification of extracellular HMGB1. In each experiment the values are normalized to the values for the 5 Gy treatment. p values were calculated as described in the Materials and methods section (not included for medium controls). Immunoblots on top of the bar charts are from a representative experiment. (C) Micrographs of U2OS cells stained with antibody against HMGB1 (green), the nuclear stain Hoechst (blue) and cell membrane staining, fluorochrome-conjugated WGA (red) at 72 hours post treatment. White arrows indicate cells with cytoplasmic HMGB1 signal. Scale bar = 20 µm. (D) Relative levels of intracellular HMGB1 in viable U2OS cells at indicated time-point after treatment with ionizing radiation (5 Gy; IR) and/or the ATR inhibitor VE822 (250 nM), as measured by flow cytometry. Cells were stained with Pacific Blue (PB) before fixation to distinguish between viable (PB-) and non-viable (PB+) cells. (Viable cells were gated as in Supplementary Figure S2B ). n = 2. *p ≤ 0.05, **p ≤ 0.01, ***p ≤ 0.001.

