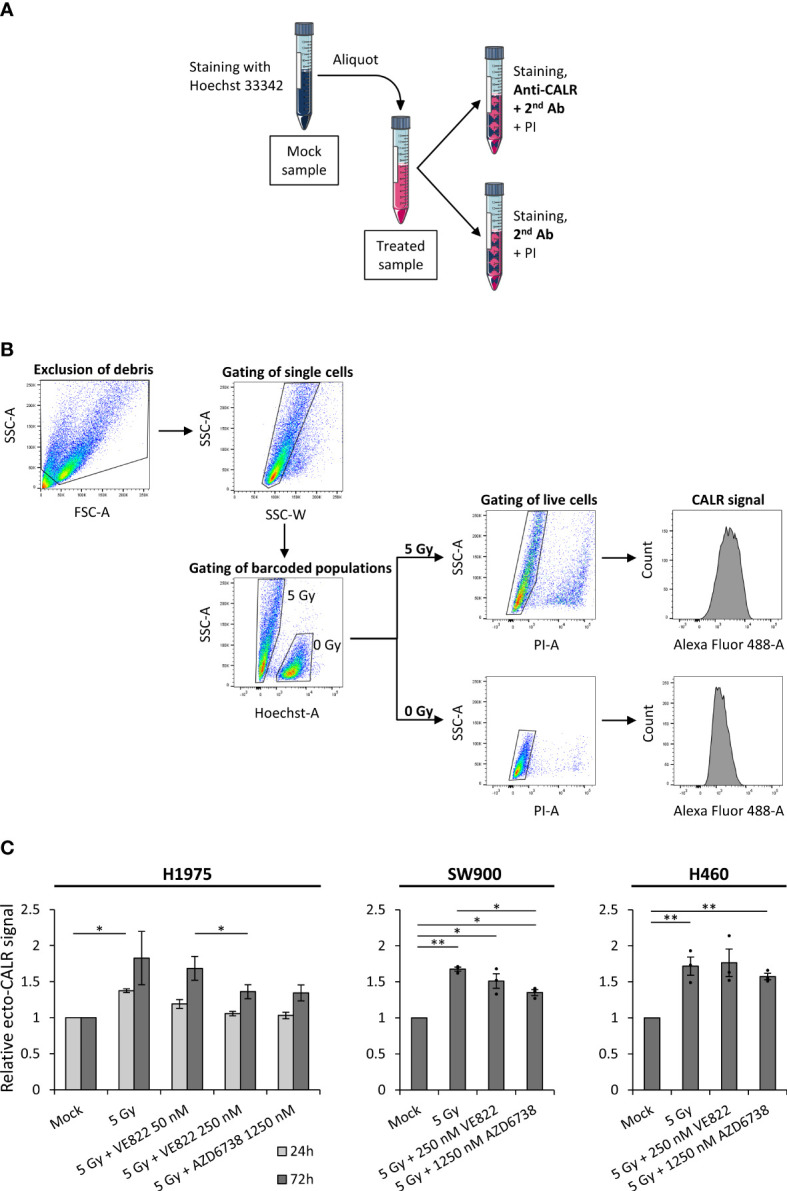
Figure 3.

Surface-presentation of calreticulin is increased upon irradiation, but is not further increased by the addition of ATR inhibitors. (A) Procedure of Hoechst 33342-based barcoding, in which a live mock sample was stained with permeable Hoechst 33342, before it was divided equally to differently treated live-cell samples. Each of the barcoded samples were thereafter split into two aliquots; one for primary anti-calreticulin (anti-CALR) staining and one for secondary antibody control staining. The two aliquots were thereafter stained with propidium iodide (PI) for discrimination of live and dead cells. (B) The gating hierarchy employed for the flow cytometry analysis. Debris was excluded and cells were gated in a forward-scatter area (FSC-A) versus side-scatter area (SSC-A) plot. Cell singlets were gated in a side-scatter width (SSC-W) versus SSC-A plot. The barcoded populations were separated in a Hoechst-A versus SSC-A plot, in which the Hoechst 33342-stained mock population is shifted upwards the Hoechst-A axis. Live cells were gated in PI-A versus SSC-A plots, in which dead (PI+) cells are shifted upwards the PI-A axis. Finally, histograms of the ecto-CALR signals (Alexa Fluor 488) are obtained from the live cells in both of the barcoded populations, and the median value of ecto-CALR signal is obtained from each histogram. Similar gating hierarchy and analysis was done for the secondary antibody control samples. (Demonstrated in H1975 cells). (C) Results from experiments performed as in (A, B) for H1975, SW900 and H460 cells after treatment with ionizing radiation and ATR inhibitors. Bar charts show ecto-CALR signals normalized to the barcoded mock population of each sample. Note that results from both a 24 hours time-point (light grey) and 72 hours time-point (dark grey) are shown for H1975, whereas results from the 72 hours time-point are shown for SW900 and H460. *p ≤ 0.05, **p ≤ 0.01.
