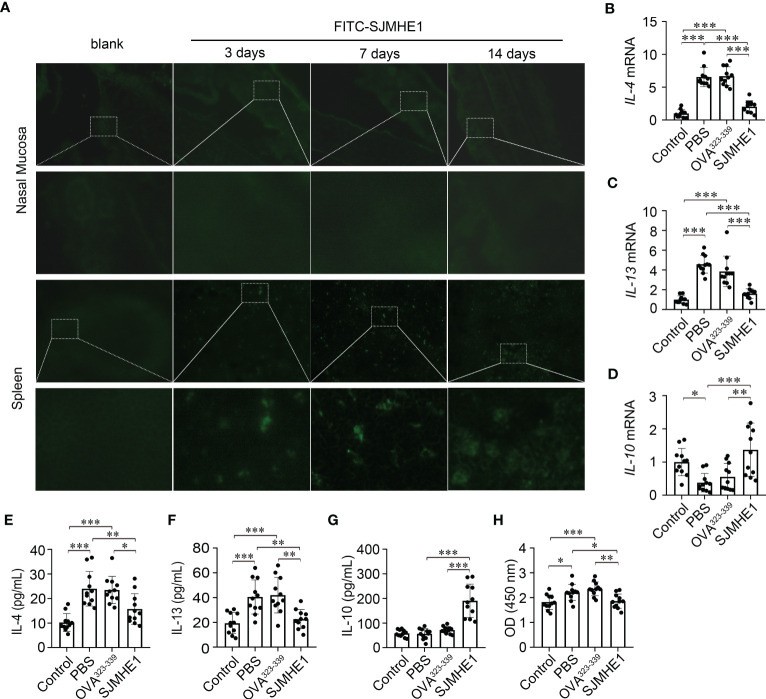
Figure 5.
SJMHE1 accumulates in spleen and regulates the systemic immune response in AR mice. (A) Immunofluorescence of FITC-SJMHE1 (green) in nasal mucosa and spleen of mice at day 3, 7, and 14 after FITC-SJMHE1 treatment. Quantitative analysis for relative IL-4 (B), IL-13 (C) and IL-10 (D) genes expression in the spleen of mice. Data are presented as mean ± SD (n = 11) from two independent experiments. Each dot represents data from one animal. (E–G) Statistical analysis of IL-4, IL-13 and IL-10 levels in the serum, respectively. Data are presented as mean ± SD (n = 11) from three independent experiments. Each dot represents data from one animal. (H) OVA-specific IgE level in serum of mice. Data are presented as mean ± SD (n = 11) from three independent experiments. Each dot represents data from one animal. One-way analysis of variance (Tukey Kramer post hoc tests): *P<0.05, **P<0.01, ***P<0.001.

