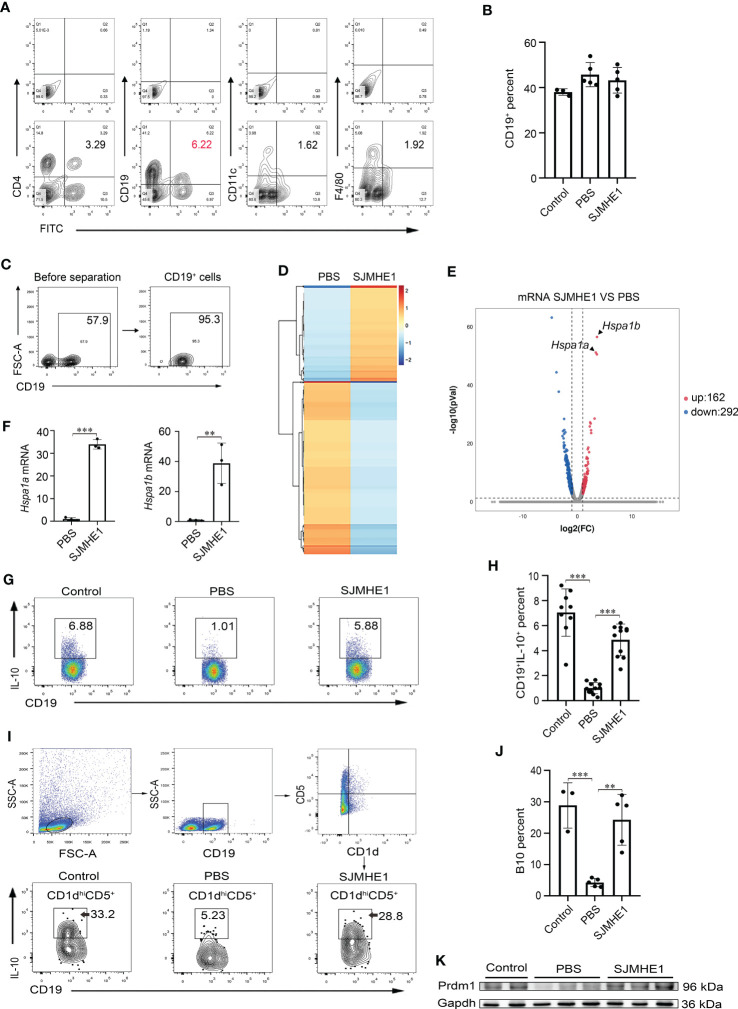
Figure 6.
SJMHE1 binds to B cells in the spleen and upregulates the ratio of Bregs and B10 cells. (A) The percentages of CD4+FITC+ cells, CD19+FITC+ cells, CD11c+FITC+ cells and F4/80+FITC+ cells in spleen were analyzed by flow cytometry, and (B) percentage of CD19+ cells is shown (n = 3-5). (C) Splenocytes from mice were enriched for CD19+ cells using a flow cytometry sorter. (D) Gene expression profiles of the PBS and SJMHE1 groups were clustered in an unsupervised hierarchical manner. The heat map of differentially expressed genes identified by clustering analysis is shown in the figure. Each column represents a sample and each row represents a gene. Red and blue colors indicate genes with up- and down-regulated expression, respectively. (E) Dot plot shows 454 significantly differentially expressed (P < 0.05 and |log2FC| > 1) genes with 292 downregulated and 162 upregulated in the SJMHE1 group. FC: fold change. (F) Real-time PCR analysis of Hspa1a and Hspa1b mRNA levels in CD19+ B cells isolated from mouse splenocytes (n = 3). (G, H) Percentages of CD19+IL-10+ cells. Data are presented as mean ± SD (n = 9-11) from three independent experiments. Each dot represents data from one animal. (I, J) IL-10+ B-cell frequencies gated on CD1dhiCD5+ (n = 3-5). (K) Prmd1 expression in spleen of mice was detected by Western blotting (n = 2-3). One-way analysis of variance (Tukey Kramer post hoc tests) and Student’s t test: **P<0.01, ***P<0.001.

