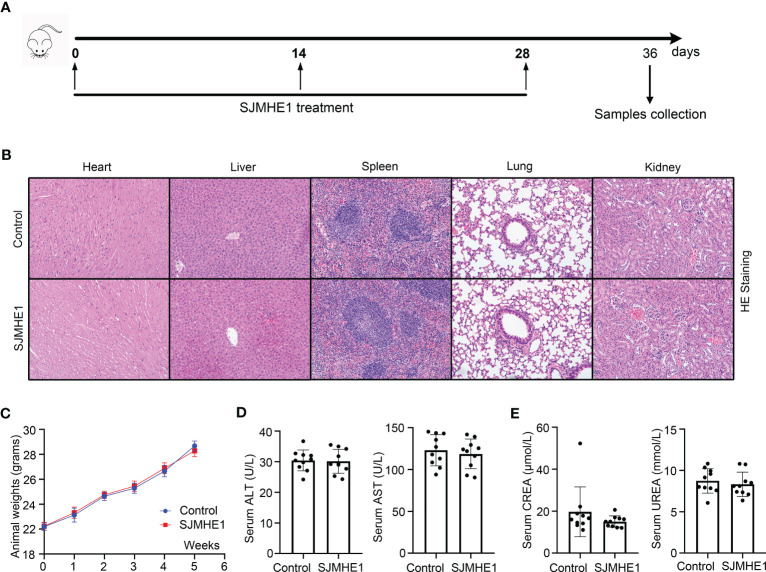
Figure 8.
Biocompatibility evaluation of SJMHE1. (A) Schematic diagram for SJMHE1 treatment. (B) HE staining. (C) Body weight of mice. (D, E) The indicators reflecting the physiological functions of the liver (ALT and AST) and kidneys (CREA and UREA) were tested. Each dot represents data from one animal, and data are presented as mean ± SD (n = 10) from three independent experiments. Student’ s t test.

