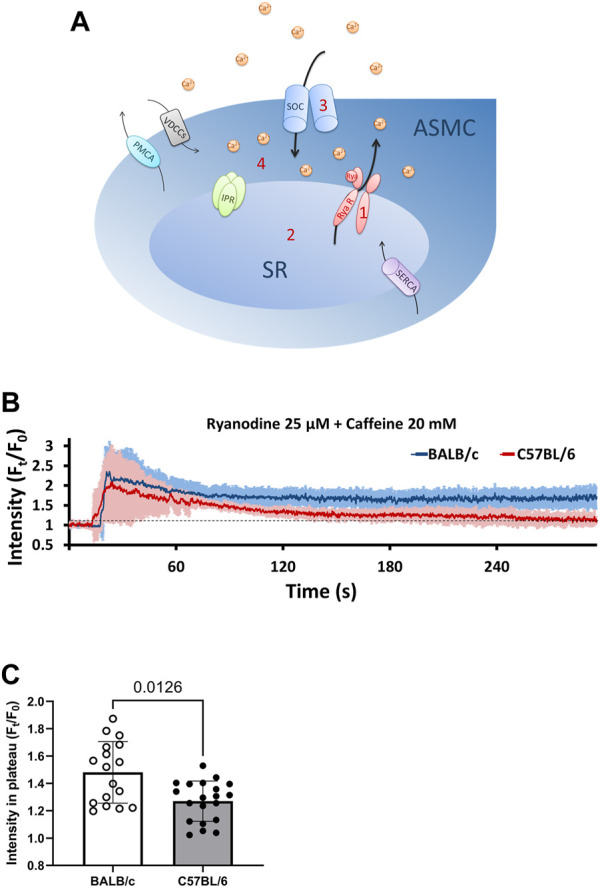
FIGURE 4.

BALB/c mice show higher levels of [Ca2+]i in SOCE-activated ASM cells than C57BL/6 mice. (A) A sketch illustrates the development of SOCE-activated ASM cells: 1, PCLS were treated with 25 μM ryanodine (Rya) and 20 mM caffeine simultaneously to “lock” the ryanodine receptors (RyR) of SR in an open state; 2, Opening of RyR leads to the depletion of SR Ca2+; 3, Ca2+ depletion in SR induces Ca2+ influx through SOC to form SOCE; 4, The steady level of [Ca2+]i in SOCE-activated ASM cells results from a dynamic balance of Ca2+ influx through SOCE, Ca2+ efflux from SR through RyR, Ca2+ uptake to the SR by SERCA, and Ca2+ efflux through plasma membrane Ca2+ ATPase (PCMA) and Na+/Ca2+ exchanger (NCX). (B) SOCE-activated PCLS is prepared by exposing PCLS to a cocktail of 25 μM ryanodine and 20 mM caffeine at 37°C, ASM cells from BALB/c mice (BLUE line) show a higher steady level of [Ca2+]i than those from C57BL/6 mice (RED line). Each point of the line represents the mean ± SD of the intensity at selected time points (Ft) normalized to the initial intensity at the beginning time (F0). (C) Comparison of steady levels (Ft/F0) in SOCE-activated ASM cells derived from BALB/c and C57BL/6 mice. Data are presented as the mean ± SD, p = 0.0126. Data are obtained from 17 ASM cells of 5 BALB/c mice, and 20 ASM cells of 5 C57BL/6 mice, respectively.
