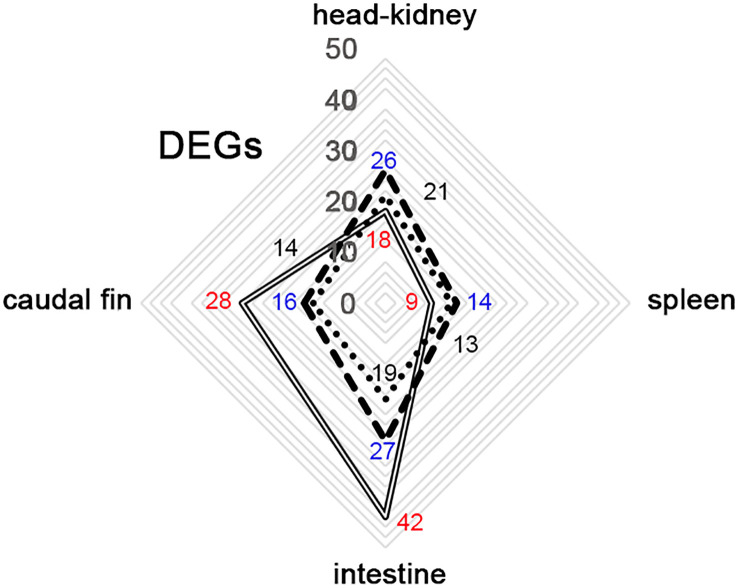
Figure 2.
Distribution of differential expressed genes (DEGs) between organs from gilthead seabream infected with LCDV-Sa in non-vaccinated (full-line), vaccinated (segmented-line), and mock-vaccinated (dotted-line) animals through the whole experiment. Number of DEGs detected in the different experimental groups: in blue (vaccinated), black (Mock-vaccinated), and red (non-vaccinated).

