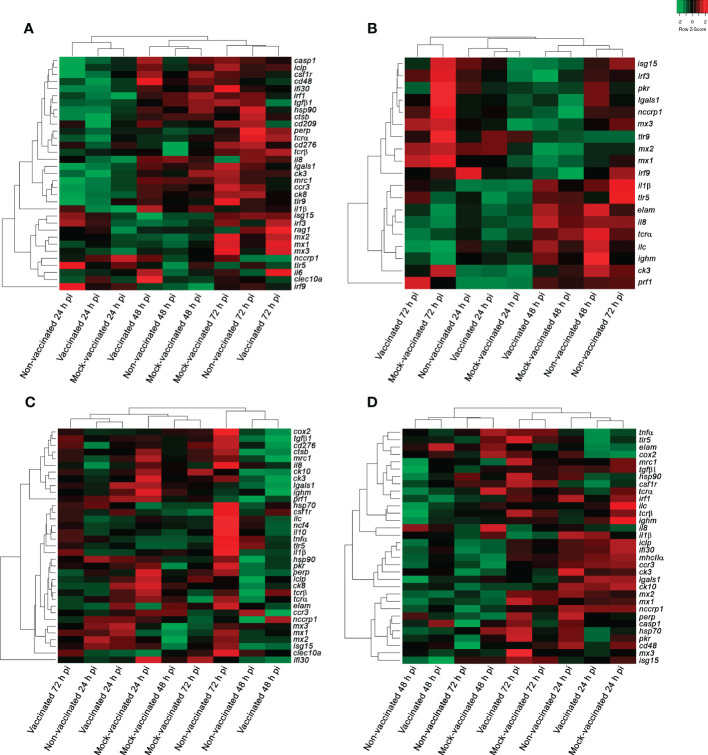
Figure 3.
Hierarchical clustering analysis of samples from non-vaccinated, vaccinated, and mock-vaccinated LCDV-Sa infected gilthead seabreams at 24, 48, and 72 h pi. (A) Head-kidney, (B) spleen, (C) intestine, and (D) caudal fin samples. Green and red colors indicate down- and up-regulation of genes according to the scale shown [Log2 (FC)].

