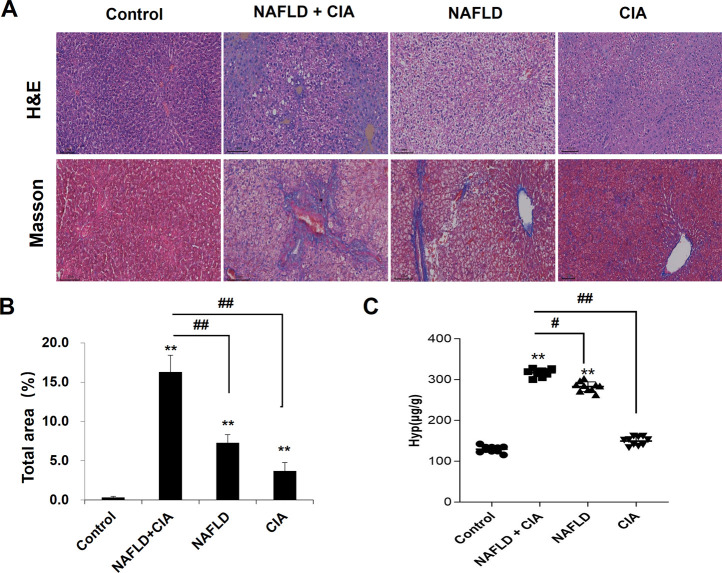
FIGURE 4.
Histopathologic changes of the liver in CIA and NAFLD rats. (A) Hepatic histopathology in rats determined by HE and Masson’s trichrome staining. Scale bar = 100 µm. (B) Quantitative analysis of Masson’s trichrome staining area. (C) The content of Hyp in the liver. Data are presented as mean ± SD, n = 10. **p < 0.01 vs. control, # p < 0.01 vs. CIA + NAFLD, ## p < 0.01 vs. CIA + NAFLD.

