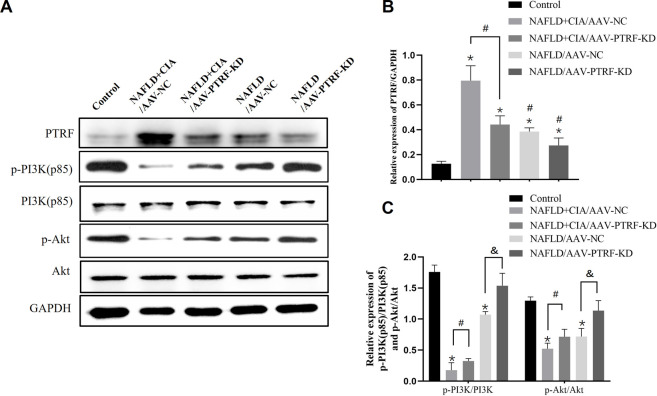
FIGURE 6.
The expression of PTRF and the proteins in the PI3K/Akt signaling pathway in NAFLD/RA rats. (A) Western blot analysis of the expression of the proteins PTRF, PI3K (p85), p-PI3K, Akt, and p-Akt in liver tissues. (B) Densitometric analysis of PTRF expression. GAPDH was used as the internal control. (C) Representative quantitative analyses of PI3K (p85), p-PI3K, Akt, and p-Akt levels. Data are reported as mean ± SD (n = 3). *p < 0.05 vs. control group, # p < 0.05 NAFLD + CIA/AAV-NC, & p < 0.05 NAFLD/AAV-NC.

