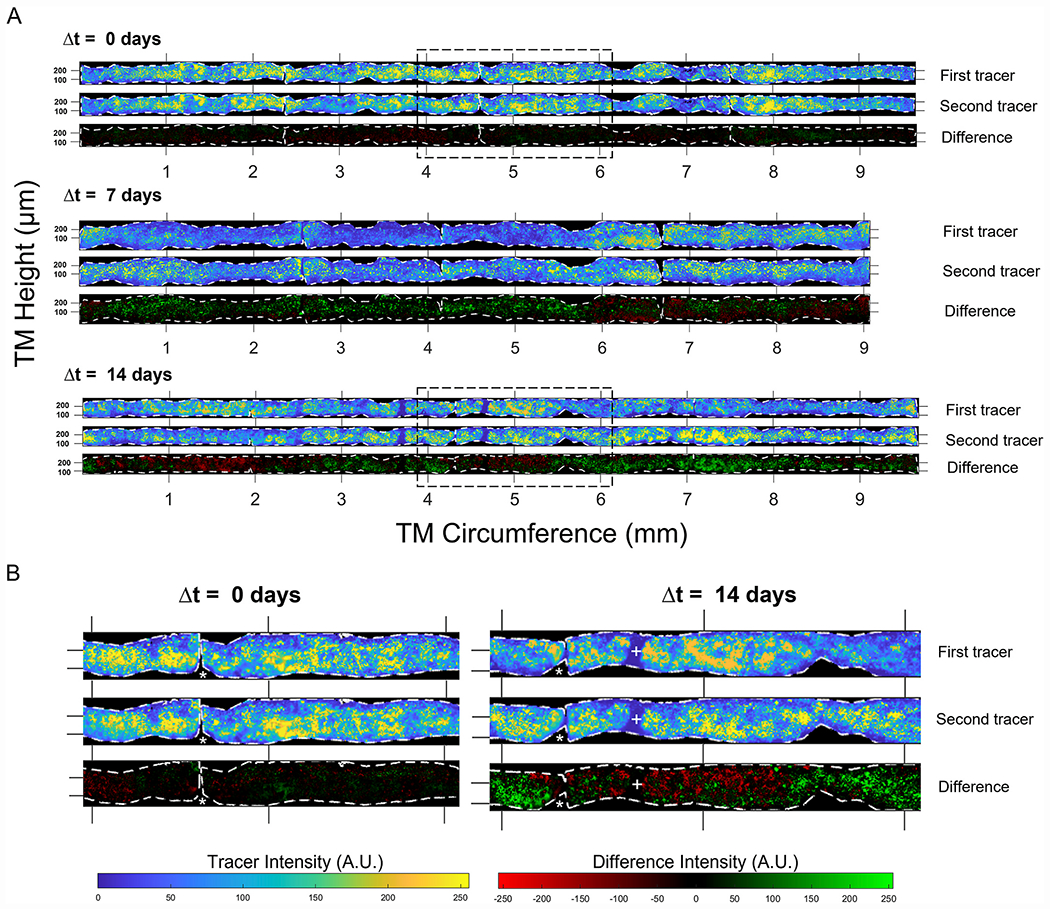
Fig. 3.

Tracer labelling patterns in the TM change over time in living mice. (A) Representative images of tracer labelling patterns in the TM from three different eyes of 3-month-old mice, where tracers were delivered at Δt = 0, 7, or 14 days apart. The signal from each tracer was straightened (see Fig. 1) and the fluorescent intensity was pseudocoloured to display low pixel values in blue and high pixel values in yellow, independent of the actual tracer colour. Black pixels lie outside of the TM domain, which is demarcated by the dashed white borders. The difference images show the result of subtracting the first tracer image from the second, with green (or red) regions representing an increase (or decrease) in the second tracer relative to the first. The images shown for Δt = 0 days and Δt = 14 days coincide with the tracer intensity profiles and correlations shown in Fig. 2. (B) Magnified images from boxed regions of panel A to show the fine detail of the tracer labelling patterns in the TM. Asterisks represent gaps in the TM domain where an incision was made between quadrants in the flat-mount image (see Fig. 1). Regions of consistent low tracer intensity are indicated by + symbols. Ticks along the horizontal or circumferential axis demarcate steps of 1 mm, while the ticks on the vertical or anterior-posterior axis demarcate steps of 0.1 mm.
