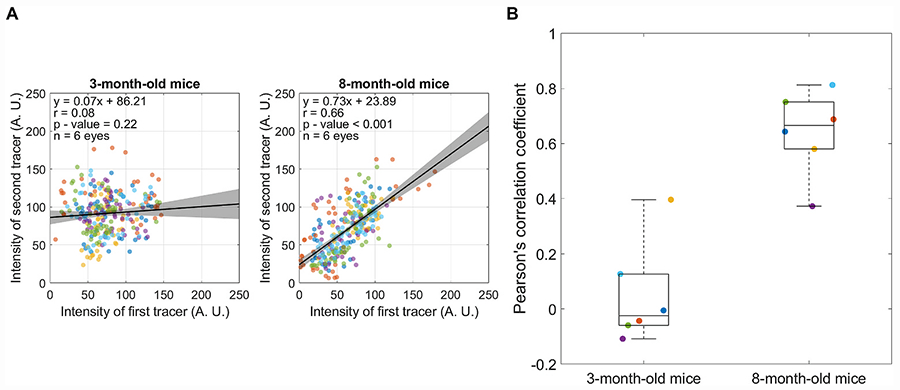
Fig. 6.

Comparison of the Pearson’s correlation coefficient (r) between 3-month-old and 8-month-old mice when tracers were delivered with a time interval of Δt = 14 days. (A) Linear regression between the two tracer patterns, with each data point representing the average tracer intensities from individual bins and marker colours indicating separate eyes. All data were pooled to calculate the value of r displayed on each plot. Black lines and shaded regions indicate the best fit linear regression (given by equation) and 95% confidence intervals, respectively. (B) There is a significant difference between the value of r measured in older mice versus that measured in younger mice (p < 0.001). Data points represent r for individual eyes, and the box-and-whisker plots represent the interquartile range (box), median (centreline) and full range of data (whiskers). Marker colours are preserved, such that data points of the same colour are obtained from the same eyes in panels A and B.
