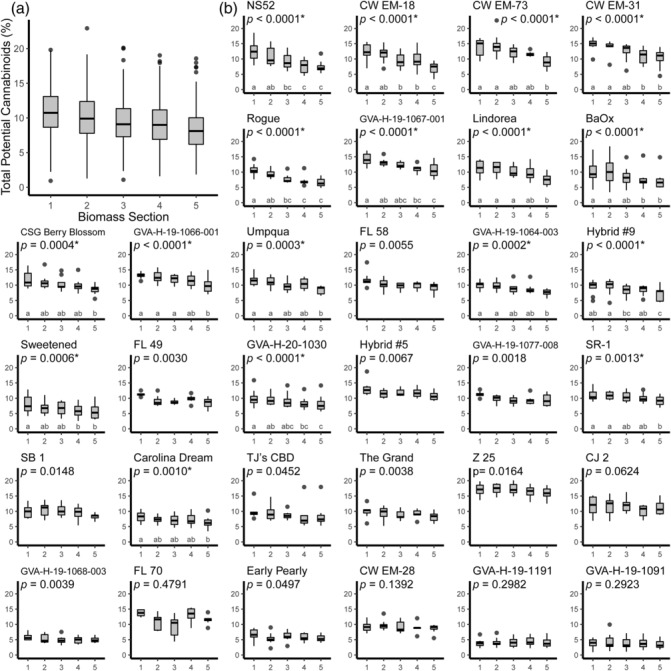
FIGURE 6.

Boxplots showing the distribution of total potential cannabinoid concentration measured in post‐harvest stripped biomass samples for plants partitioned into five sections where S1 represents branches derived from the top fifth of the main stem, S2 those from the second to top, and so on. (a) Boxplot of all samples from all cultivars. (b) Thirty‐two cultivar‐level boxplots ordered by the slope of the regression predicting total potential cannabinoids using biomass section. P‐values reported are for mixed models predicting total potential cannabinoid concentration where biomass section was a fixed effect and the plot that the sample was from was a random effect. Asterisks indicate a significant effect of biomass section after correcting for multiple testing and letters indicate statistically significant differences between sections of a cultivar based on a post hoc Tukey's HSD test.
