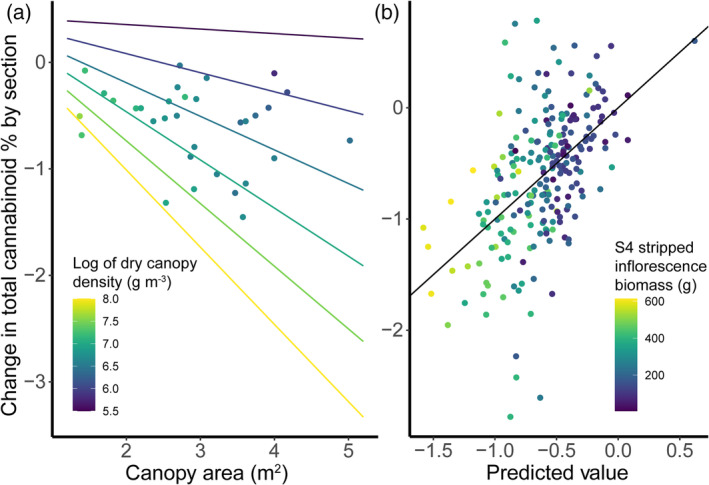
FIGURE 7.

Regressions predicting changes in total cannabinoid concentration by section. (a) Multiple linear regression predicting cultivar‐level values using canopy area, log of dry canopy density, and an interaction term as predictors. (b) Regression of plant‐level observed values against predicted values for multiple linear regression where predictors were selected by stepwise regression. The solid black line represents a perfect correlation of predicted and observed values.
