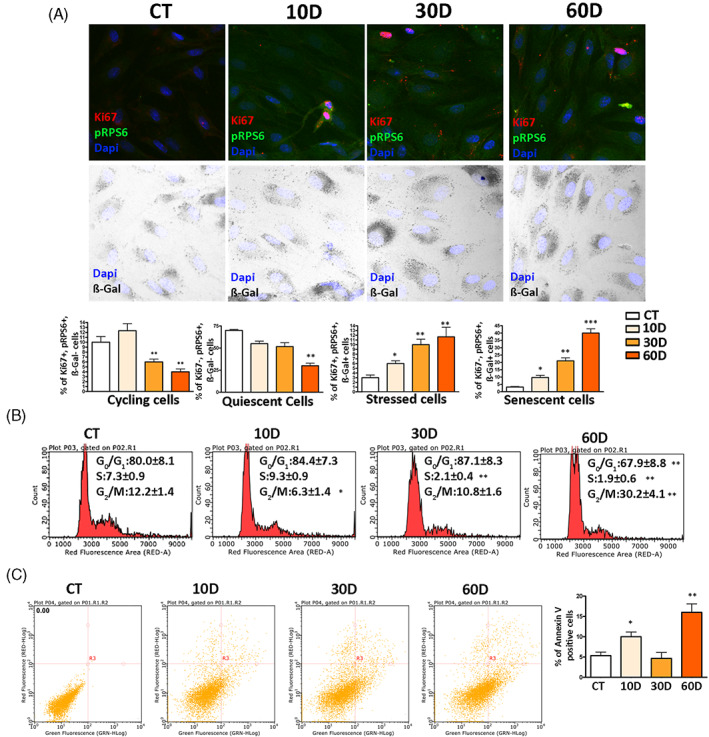
FIGURE 1.

Biological parameters of MSCs following x‐ray exposure. Panel A: representative images of cells stained to identify nuclei (DAPI), pRPS6, Ki67 and to determine β‐gal activity. The graphs show the percentage of cycling, quiescent, stressed and senescent cells. In each graph, the * indicates the statistical difference between CT, chosen as the reference, and the other time points. Data are shown with standard deviation (SD), n = 3 (*p < 0.05, **p < 0.01, ***p < 0.001). We used Leica CTR500 microscope equipped with a DCF3000G digital monochrome camera. The β‐gal activity was recorded as a grey‐stain with this setting. This experimental approach was used to identify in the same cell, a marker emitting a signal in the visible light (β‐gal) together with others expressing fluorescent signals. Panel B: Cell‐cycle profiles of samples collected at different time points following x‐ray treatment. The * indicates the statistical difference between CT, chosen as the reference, and the other time points. Data are shown with standard deviation (SD), n = 3 (*p < 0.05, **p < 0.01). Panel C: Flow cytometry chart of annexin V assay. The percentage of apoptotic cells is indicated in the associated right histogram. Data are shown with standard deviation (SD), n = 3 (*p < 0.05 and **p < 0.01 indicate statistical significance between the control and treated samples).
