FIGURE 2.

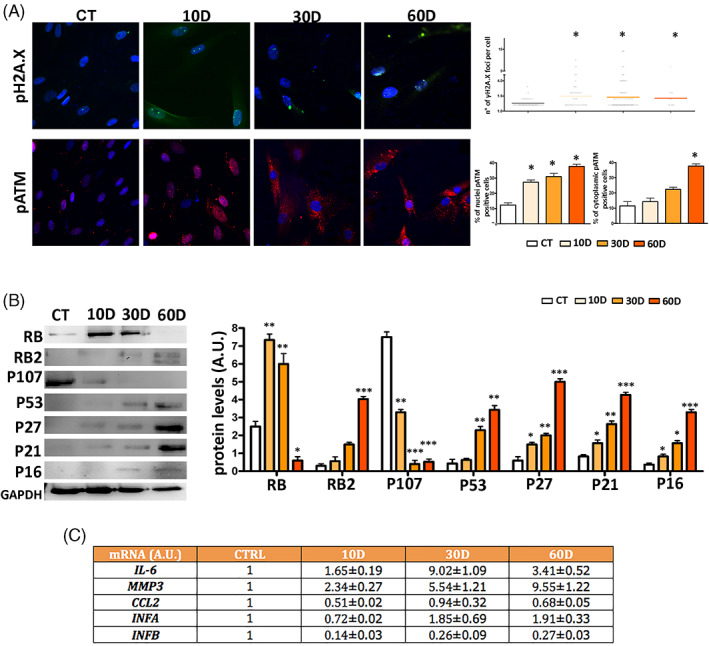
DNA damage/repair analysis and senescence‐associated signalling pathways. Panel A: Representative images of cells stained with anti‐pH2A.X (green) or pATM (red) are shown. Cell nuclei were stained with DAPI. Upper right: the graph shows the degree of pH2A.X foci per cell (n = 3 ± SD; *p < 0.05). The lower right graphs show the percentage of pATM positive cells. The protein is localized either within the nucleus or into cytoplasm (n = 3 ± SD; *p < 0.05). Panel B: A representative western blot analysis of RB/P105, RB2/P130, P107, P53, P27/KIP1, P21/CIP1, P16/INK4A and GAPDH (loading control) is shown. The right histogram reports the densitometric analysis of western blot bands. Panel C: The table reports the mRNA expression level of the indicated genes. The mRNA levels were normalized to GAPDH mRNA expression, which was selected as an internal control. For every mRNA, the change in the expression level is compared with control culture (CTRL), whose expression was fixed as 1. The symbols ***p < 0.001, **p < 0.01 and *p < 0.05 indicate statistical significance between the control and irradiated samples.
