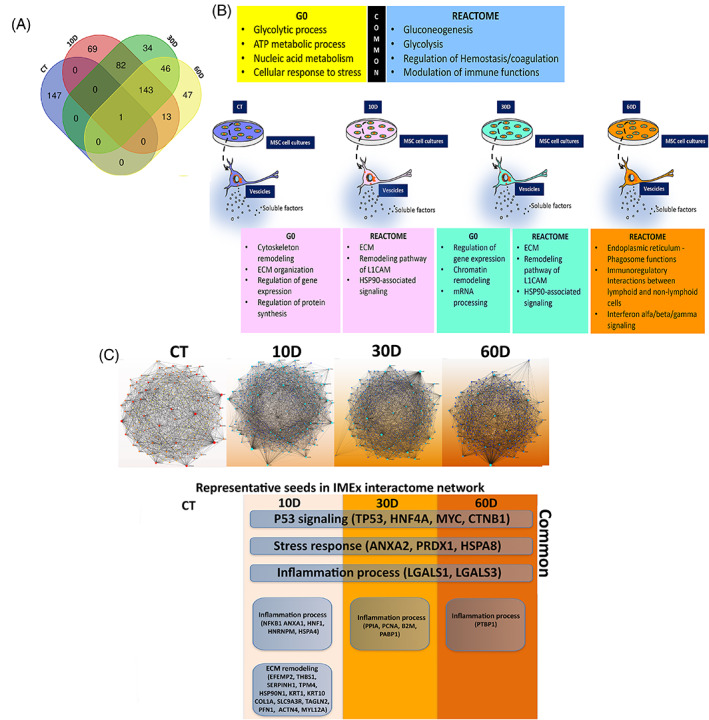
FIGURE 3.

Gene Ontology and REACTOME analysis. Panel A: Venn diagram to identify common and specific SASP components among the different experimental conditions. Panel B: main GO and REACTOME outcomes. The SASP contained both factors, which were common among control and irradiated samples (see upper boxes), and proteins that were specifically present in a given sample (see lower boxes). Our analysis was carried out on whole secretomes containing soluble factors and molecules encapsulated within extracellular vesicles. Panel C: Network analysis. The top pictures show Minimum IMEx Interactome Networks with reduced complexity obtained by considering only seeds and their connecting nodes. The bottom images show representative seeds (node degree >20 and betweenness >200). Common: indicates seeds that are present in all irradiated samples (10D, 30D, 60D).
