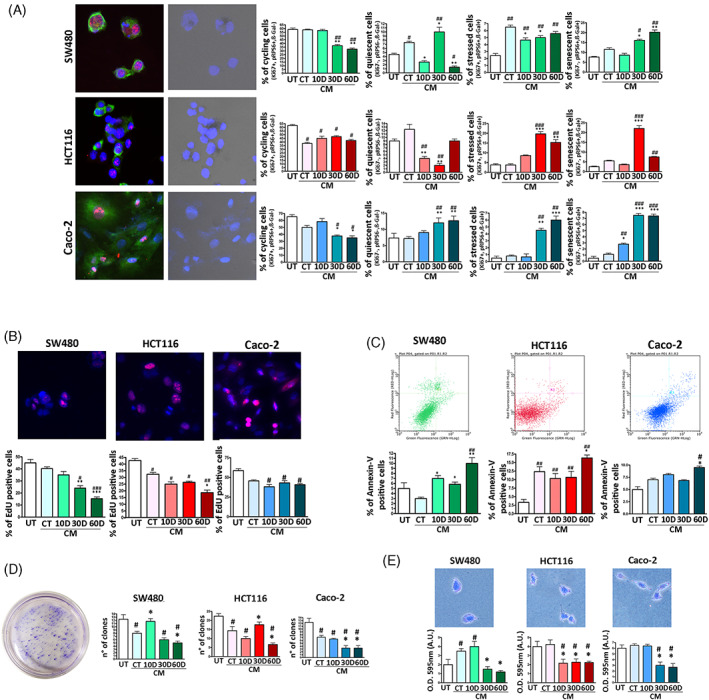
FIGURE 4.

Biological parameters of cancer cells incubated with SASP. Panel A: SW480, HCT116 and Caco‐2 cells were incubated with different MSC secretomes as reported in methods. The histograms show the percentage of cycling, quiescent, stressed and senescent cells following secretome treatment. Representative images of cancer cells stained with DAPI (blue), pRPS6 (green) and Ki67 (red) are reported on the far left. In addition, the same images were analysed under a light microscope to determine β‐gal activity (black dots). Panel B: The histograms show the percentage of EdU positive cells in the different experimental conditions. Representative images of EdU (red) and DAPI (blue) staining are reported. Panel C: The histograms show the percentage of apoptotic cells as detected by flow cytometry Annexin V assay. Representative plots of apoptosis analysis are reported. Panel D: The histograms show the number of clones obtained in colony formation assay and the migration capacity of cancer cells, which was determined by crystal violet cell staining. An example of CFU assay is depicted. Panel E: The graphs show the results of invasion/migration assay performed on, SW480, HCT116 and Caco‐2 cancer cells. The migrated cells were stained with crystal violet and a quantitative evaluation of migration capacity was performed by measuring the optical density (O.D.) of the crystal violet stain at 595 nm. UT are the untreated cancer cells. The CT, 10D, 30D and 60D acronyms indicate cancer cultures incubated with conditioned media (CM) obtained from non‐irradiated (CT) and irradiated MSCs. For all the assays, the symbols ***p < 0.001, **p < 0.01 and *p < 0.05 indicate statistical significance between the CT, chosen as reference, and 10D, 30D, 60D. The symbols ###p < 0.001, ##p < 0.01 and #p < 0.05 indicate statistical significance between the UT, chosen as reference, and the other samples.
