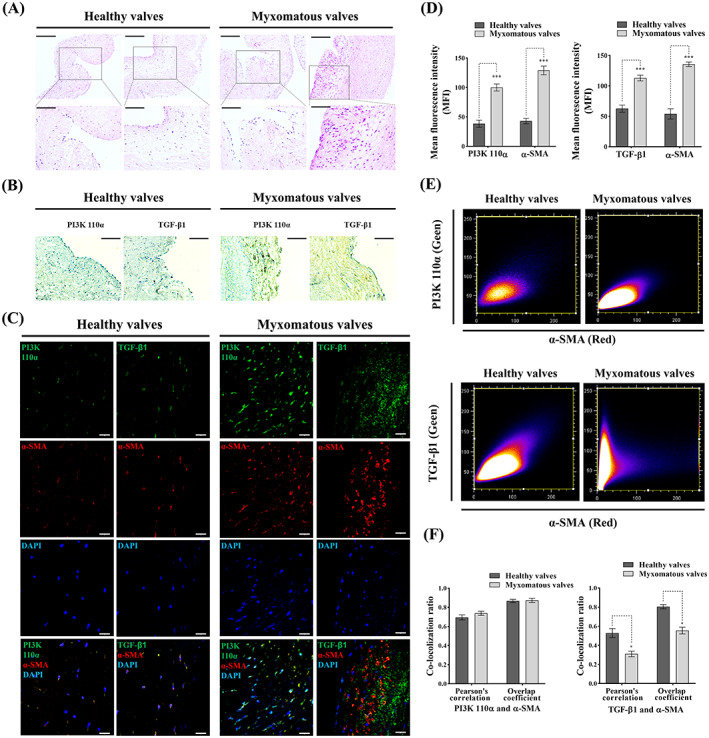
FIGURE 1.

Histopathological assessment of canine healthy and myxomatous mitral valves. (A) Representative images (two biological replicates) of H&E staining in canine healthy and myxomatous mitral valves, scale bar 200 μm (magnified 100 μm). (B) Representative immunohistochemistry images of TGF‐β1 and PI3K 110α expressions (yellow/brown) in canine healthy and myxomatous mitral valves, scale bar 100 μm. (C) Representative confocal immunofluorescent images of TGF‐β1, PI3K 110α and α‐SMA expressions in canine healthy and myxomatous mitral valves, scale bar 20 μm. (D) Quantitative analysis of mean fluorescence intensity (MFI) of TGF‐β1, PI3K 110α and α‐SMA in canine healthy and myxomatous mitral valves. (E) Representative images of co‐localization ratio analysis of TGF‐β1 (green) and α‐SMA (red), PI3K 110α (green) and α‐SMA (red) fluorescence signals in canine mitral valve tissues. (F) Quantitative analysis of co‐localization parameters (Pearson's correlation and overlap coefficient) of TGF‐β1 (green) and α‐SMA (red), PI3K 110α (green) and α‐SMA (red) fluorescence signals. Results are presented as mean ± SEM. ANOVA followed by Tukey's range test. *p < 0.05, **p < 0.01, ***p < 0.01 compared to control. ANOVA, analysis of variance; H&E, haematoxylin and eosin.
