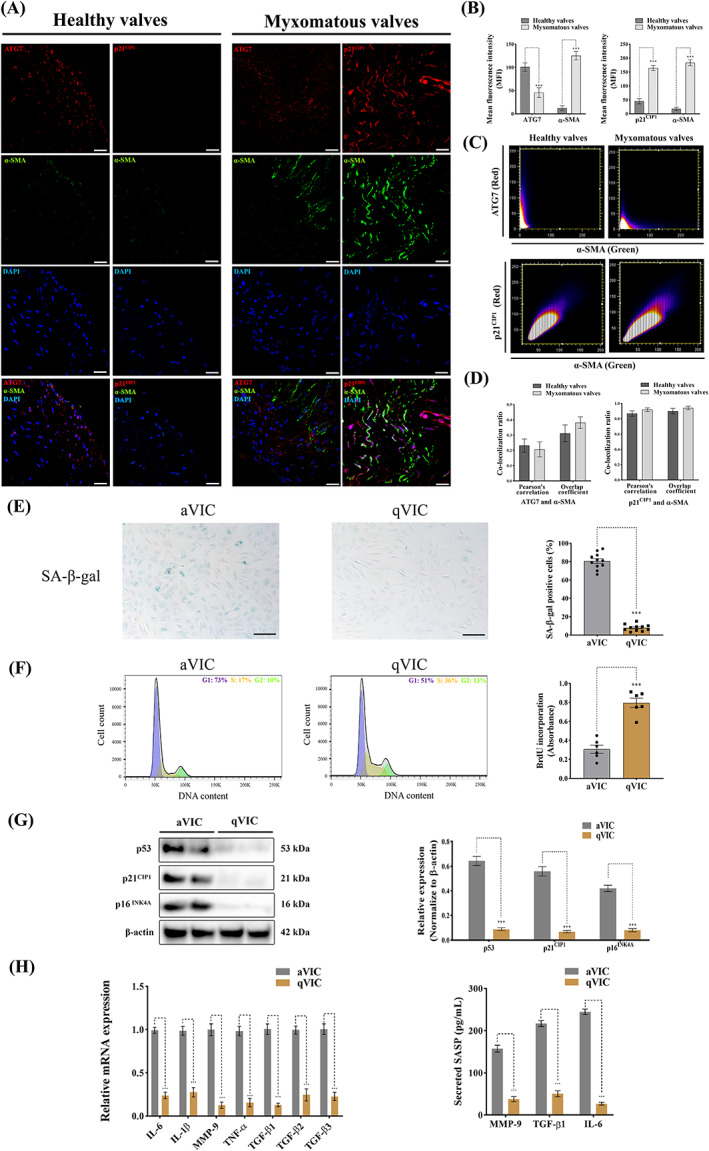
FIGURE 4.

Activated myofibroblasts (aVICs) exhibit a senescent‐associated secretory phenotype (SASP) with a reduced capacity for autophagy. (A) Representative confocal immunofluorescent images of ATG7, p21CIP1 and α‐SMA expressions in canine healthy and myxomatous mitral valves, scale bar 20 μm. (B) Quantitative analysis of mean fluorescence intensity (MFI) of ATG7, p21CIP1 and α‐SMA in canine healthy and myxomatous mitral valves. (C) Representative images of co‐localization ratio analysis of ATG7 (red) and α‐SMA (green), p21CIP1 (red) and α‐SMA (green) fluorescence signals in canine mitral valve tissues. (D) Quantitative analysis of co‐localization parameters (Pearson's correlation and overlap coefficient) of ATG7 (red) and α‐SMA (green), p21CIP1 (red) and α‐SMA (green) fluorescence signals. (E) Representative images of SA‐β‐gal (blue) staining and quantitative analysis of the percentage of SA‐β‐gal positive cells, scale bar 50 μm (n = 12 microscopic fields/treatment). (F) Cell cycle analysis (left panel) and BrdU incorporation assay (right panel) of canine aVICs and qVICs (n = 6). (G) Representative western blot of p16INK4A, p21CIP1, p53 and β‐actin protein expression and quantification of the relative protein expression in VICs (two biological replicates shown in blots, n = 6). (H) Quantitative RT‐PCR for SASP cytokine expression (left panel) and secreted TGF‐β1, IL‐6 and MMP‐9 (right panel) in collected supernatant from VIC cultures (n = 6). Results are presented as mean ± SEM. ANOVA followed by Tukey's range test. *p < 0.05, **p < 0.01, ***p < 0.001 compared to control. ANOVA, analysis of variance; VIC, valve interstitial cell.
