
FIGURE 4.
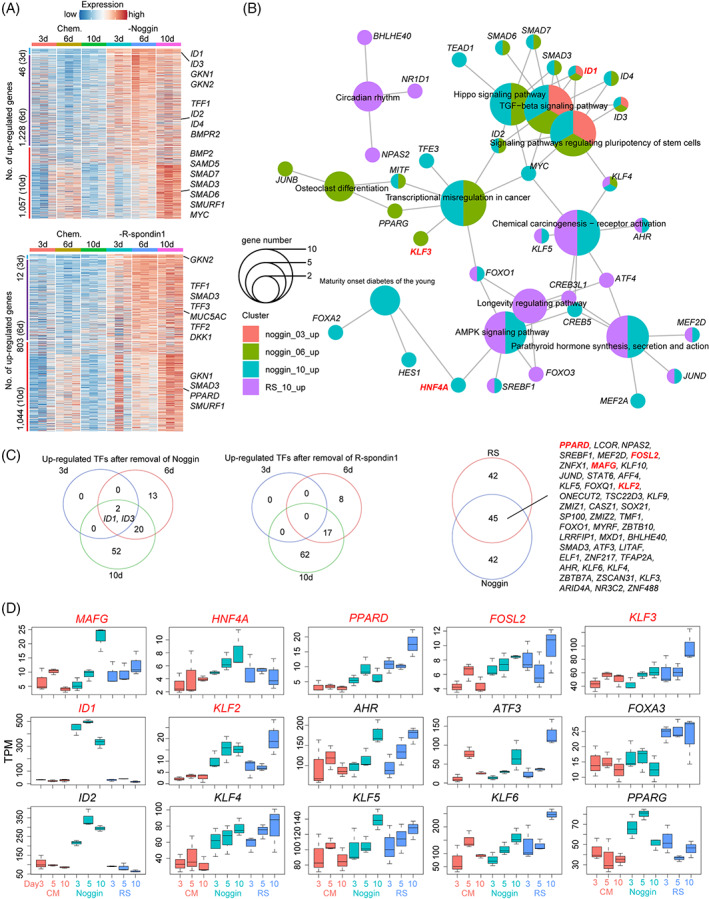
Roles of Noggin and R‐spondin1 in hGEPL cells. (A) Heatmap exhibiting the upregulated DEGs after 3, 6 and 10 days of Noggin (up) or R‐spondin1 (bottom) removal in hGEPL cell line. The colour key from blue to red indicates low to high expression levels, respectively. (B) Enriched KEGG pathways using the upregulated DEGs after 3, 6 and 10 days of Noggin (up) or R‐spondin1 (bottom) removal in hGEPL cell line. (C) Venn diagrams exhibiting upregulated TFs after the removal of Noggin or R‐spondin1. (D) The expression levels of representative TFs in hGEPL cells after the removal of Noggin or R‐spondin1. RS, R‐spondin1; DEG, differentially expressed gene; hGEPL, human gastric epithelial progenitor‐like; TF, transcription factor.