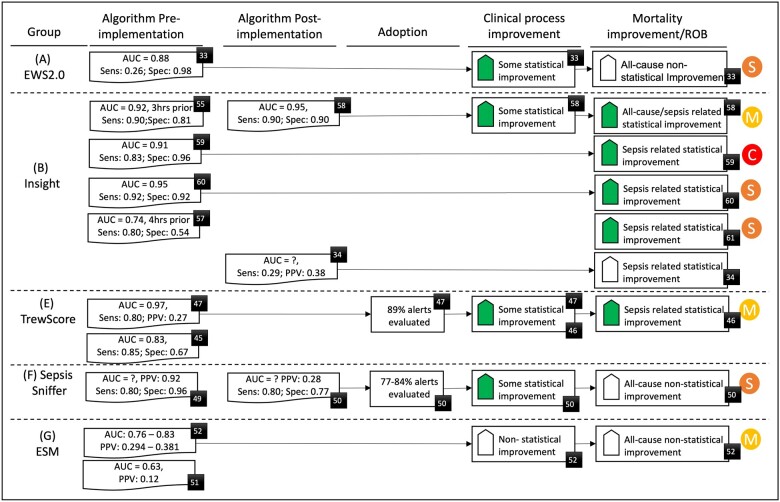
Figure 2.
Evaluation results for algorithm performance, adoption, clinical process, and mortality improvement for each MLA group. Figure includes risk of bias (RoB) assessment for studies reporting mortality assessment (M = moderate [some concerns for RoB-2], S = serious, C = critical). Black numbered squares denote the cited paper for that result. AUC: area under the receiver operating curve; Sens: sensitivity; Spec: specificity; PPV/NPV: positive/negative predictive value. Solid shaded up arrow: significant improvement, whereas hollow up arrow: non-significant improvement.

