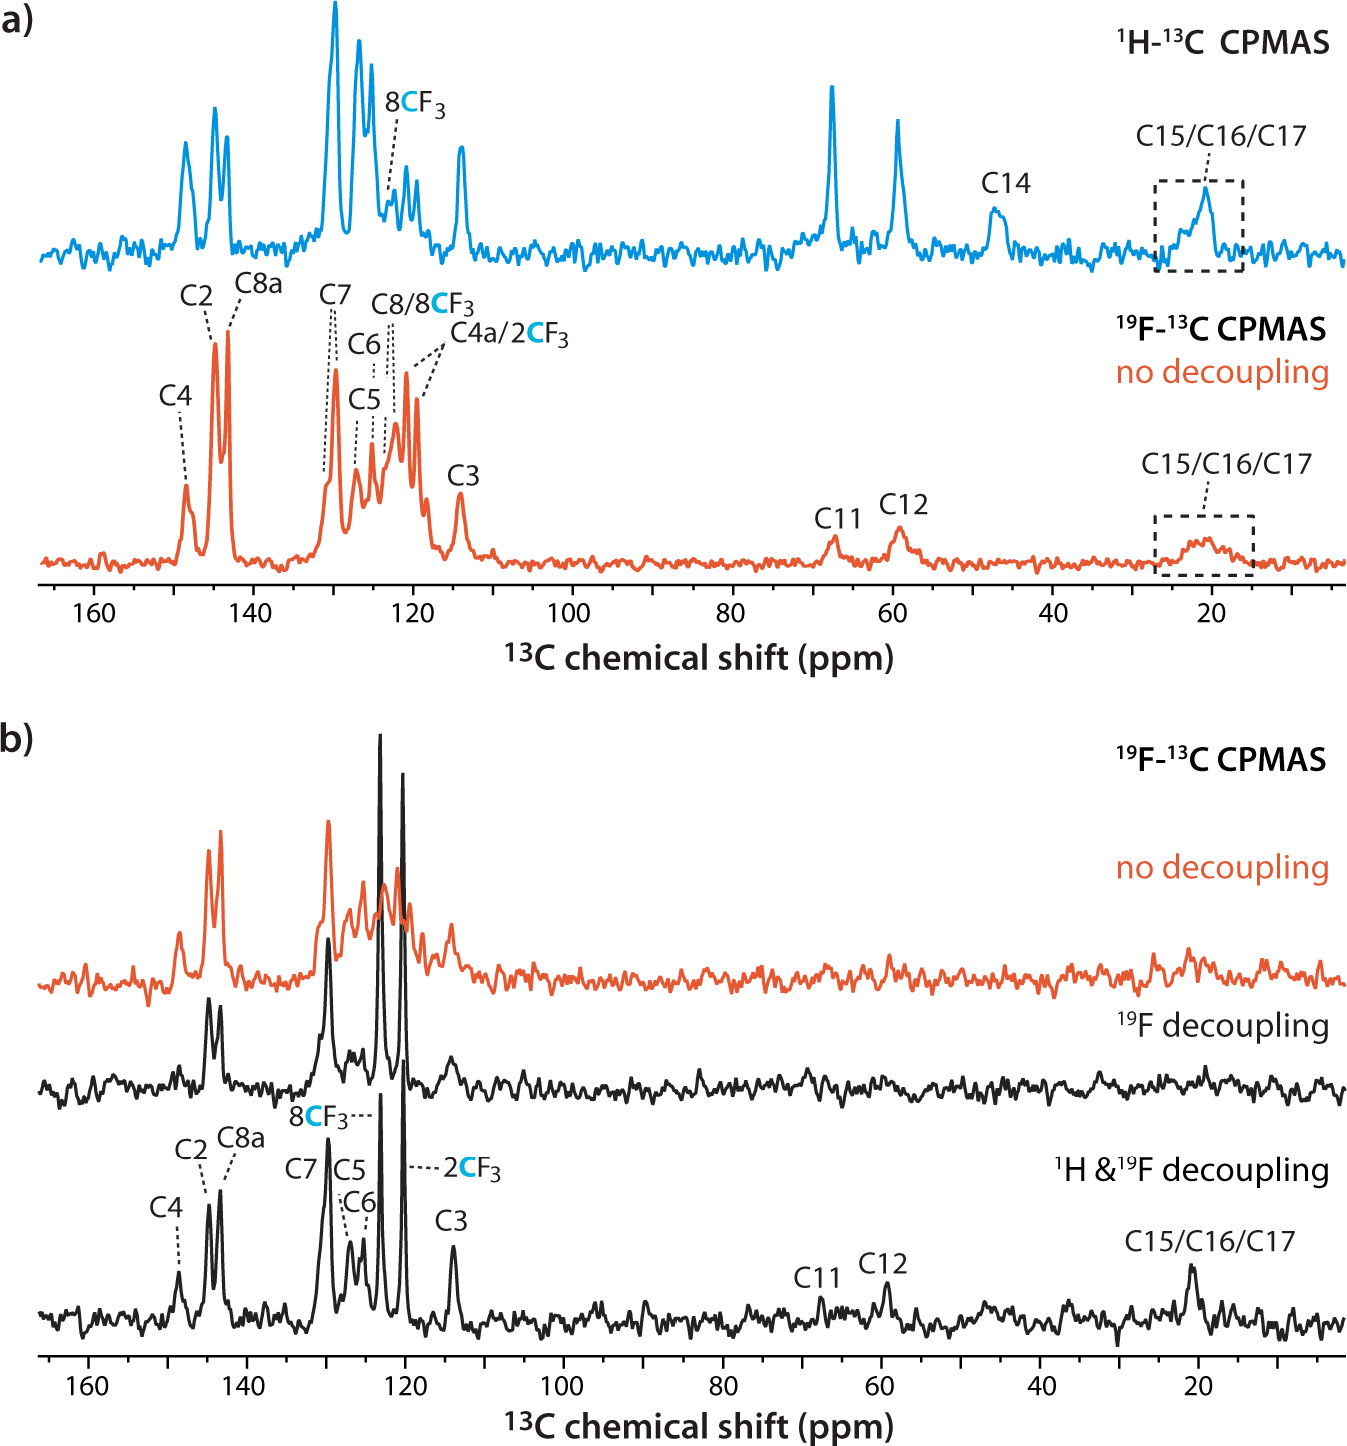
Figure 3.

a) 1H-13C and 19F-13C CPMAS spectra of mefloquine. The spectra were acquired at 20.0 T using a 1.9 mm HX MAS probe, averaging 512 scans and 1920 scans and CP contact time of 1.4 and 6 ms, respectively. The 19F-13C spectrum was acquired without decoupling. b) 19F-13C CPMAS spectra of mefloquine without decoupling acquired (top trace), with 19F decoupling (middle trace), and with 1H and 19F decoupling (bottom trace). The spectra were acquired at 16.4 T using a 1.6 mm HFXY MAS probe, averaging 512 scans; the CP contact time was 7 ms. The MAS frequency was 40 kHz in every case. Assignments for individual carbon signals are shown in the different spectra.
