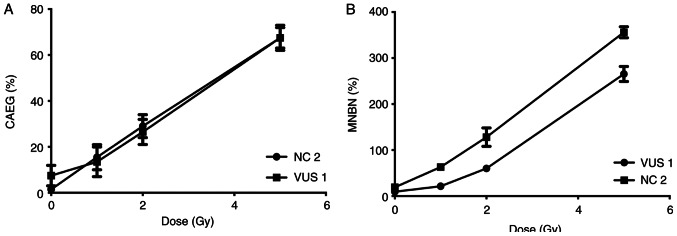
Figure 3.
Dose-response curve. Observed frequencies of (A) CAEG and (B) MNBN are represented as solid marks. Two samples were selected to evaluate the irradiation dose-response (a VUS carrier and a NC control). CAEG, chromosomal aberrations excluding gaps; MNBN, micronucleated binucleated cells; VUS, variants of unknown significance; NC, non-carrier.

