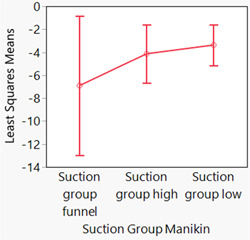
Figure 4.

Least squares means plots (and 95% confidence intervals) for the percentages of contaminated manikins (the ratio of the number of contaminated patients divided by the total number of patients). Because the logit link function was used for the generalized linear mixed model assessment, these plots use log scales. No difference was demonstrated among groups (p = .42).
