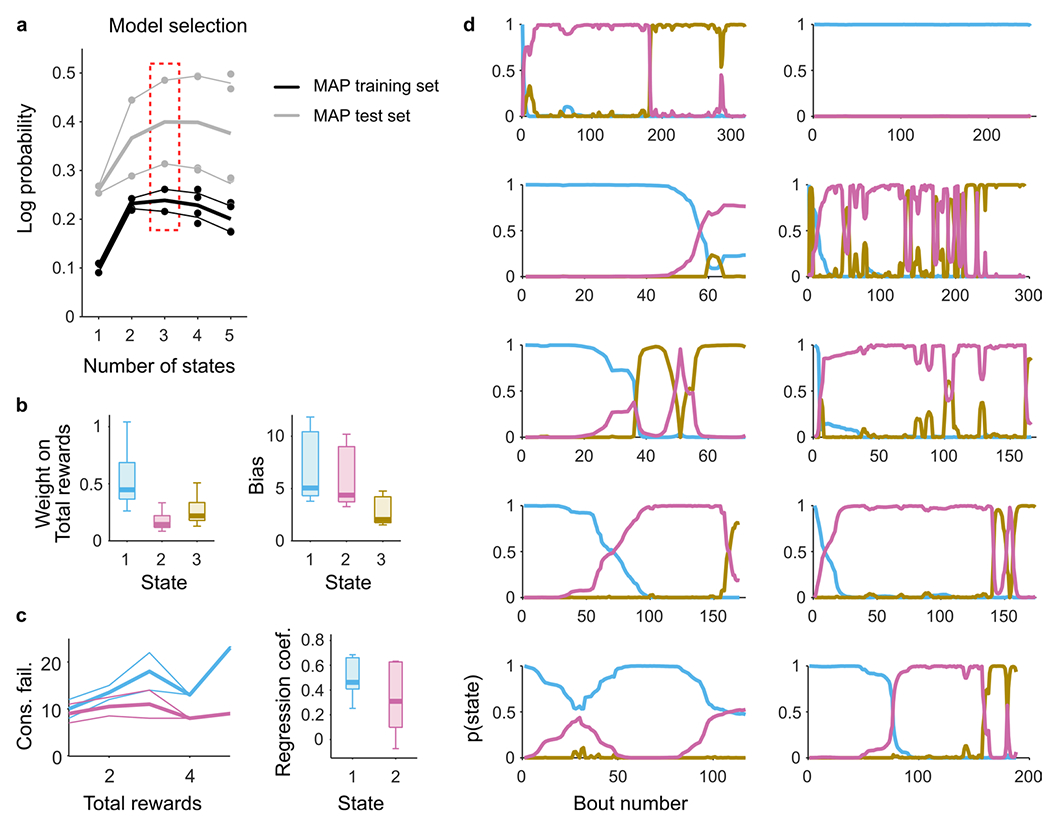
Extended Data Fig. 7 |. 1LM-HMM analysis of switch decision.

(a) To determine the number of states that best capture the decision-making of mice, we fit the LM-HMM with a varying number of states and then performed model comparison using cross-validation (see Methods for details). Training and test sets maximum a posteriori (MAP, with gaussian prior on the weights and Dirichlet prior on transition probabilities) are reported in units of bits per bout (median ± MAD). The dash-line rectangle highlights the log probability for the three-state model, which we used for all subsequent analyses. A single model was fit to all mice, where for each session the consecutive failures and prior rewards were min-maxed (that is, divided by their max , ), obtaining normalized weights w(k) and biases b(k). Single-sessions weights and biases were then obtained from these normalized parameters as , . (b) Weights on total reward (left) and biases (right) across sessions/?? (n = 11 sessions, median ± 25th and 75th percentiles, the whiskers extend to the most extreme data points) in the different states k = 1, 2, 3. (c) Consecutive failures before leaving as a function of total reward number across behavioral bouts (median ± MAD) in an example session from two different states (state 1, blue; state 2, pink). The slope coefficients of a linear regression model that predicted the number of consecutive failures before leaving as a function of the number of prior rewards in each state are shown on the right (n = 6 sessions for state 1, n = 7 sessions for state 2, median ± 25th and 75th percentiles across sessions, the whiskers extend to the most extreme data points). This result is consistent with the classification of stimulus-bound and inference-based strategies used in Fig. 1. (d) Posterior state probabilities for each recording session. Mice often start off the session with the stimulus-bound strategy and later switch to the inference-based strategies (in 6 out of 11 sessions).
