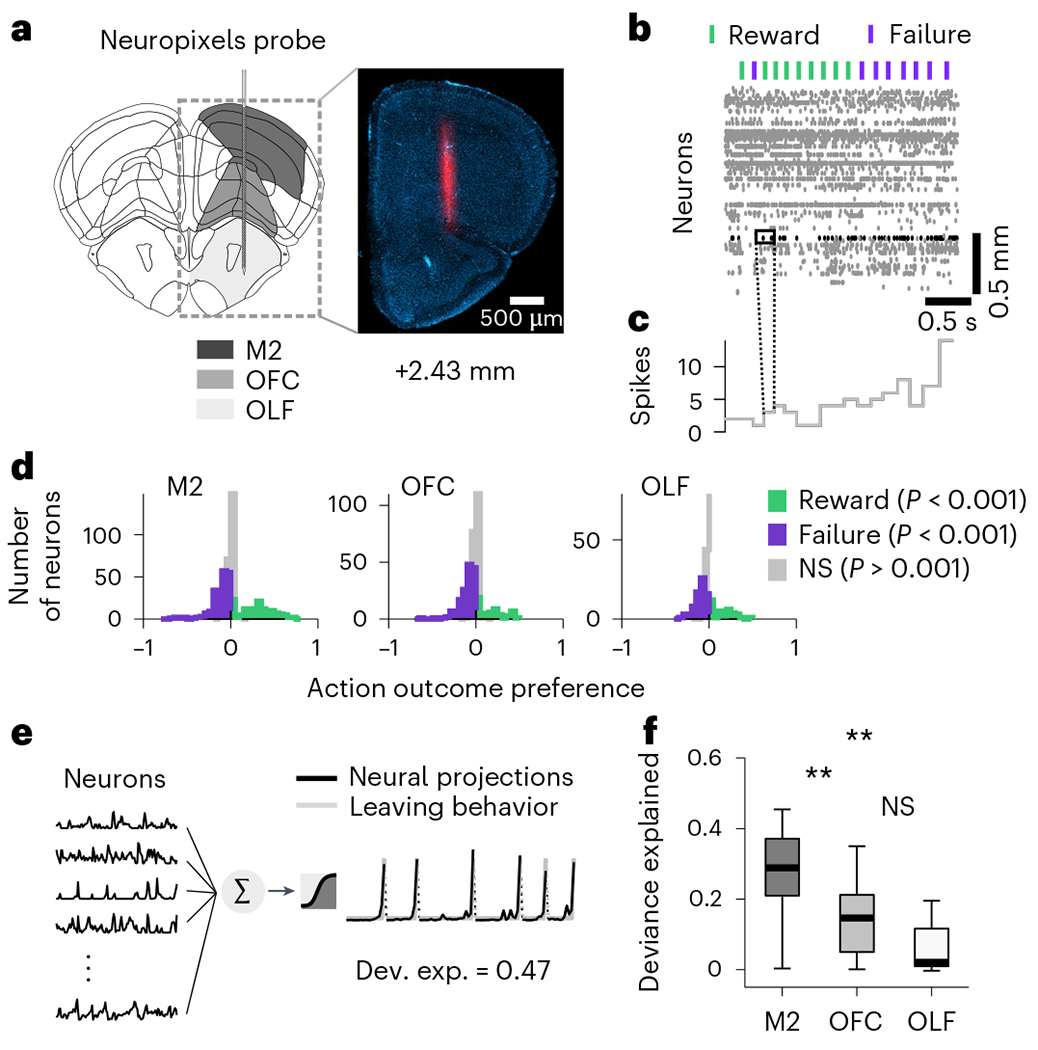
Fig. 2 |. Neural activity related to the switching decision.

a, Schematic target location of probe insertion and an example histology of electrode track (1 of 10 example brain). Vertical insertions were performed within a 1-mm diameter craniotomy centered around +2.5-mm anterior and +1.5-mm lateral from Bregma. b Example raster plot of 140 simultaneously recorded neurons from M2. Lick-outcome times are indicated by the green (reward) and purple (failure) dashes. c Binned response profile of an example neuron. For all analyses, otherwise noted, we averaged for each neuron the number of spikes into bins by considering a 200 ms window centered around each lick. d, Histogram of outcome selectivity of all neurons recorded M2 (left), OFC (middle) and OLF (right). We used ROC analysis to assign a preference index to each neuron. In brief, an ideal observer measures how well the modulation of neuronal firing can classify the outcome (reward or failure) on a lick-by-lick basis. We derived the outcome preference from the area under the ROC curve as PREFR,F = 2(ROCAREA(fR, fF) − 0.5), where fR and fF are the firing rate distributions for trials where outcomes are reward and failure, respectively. This measure ranges from −1 to 1, where −1 indicates preference for F (failure), 1 means preference for R (reward) and 0 represents no selectivity. The statistical significance of the preference index (P < 0.001, one-sided) was assessed via bootstrapping (1,000 iterations). Violet and green bars indicate neurons where the index was significantly different from 0. In all regions, we found neurons significantly modulated by rewards and failures. e, Illustration of the logistic regression method for predicting the switching decision (gray right, that is, the probability that each lick was the last in the bout, n = 2,533 ± 1,524 licks per session; mean ± s.d. across 11 sessions) from the principal components of neurons (left-M2, n = 31 ± 17; OFC, n = 29 ± 9; OLF, n = 16 ± 13). f, Deviance explained from the logistic regression in each region. Two stars indicate a significant difference between regions (two-sided Wilcoxon signed rank test, P = 0.0068 between M2 and OFC; P = 0.0049 between M2 and OLF; P = 0 between OFC and OLF). On each box, the central mark indicates the median across recording sessions (n = 11 sessions), and the bottom and top edges of the box indicate the 25th and 75th percentiles, respectively. The whiskers extend to the most extreme data points. NS, not significant; ROC, receiver operator characteristic.
