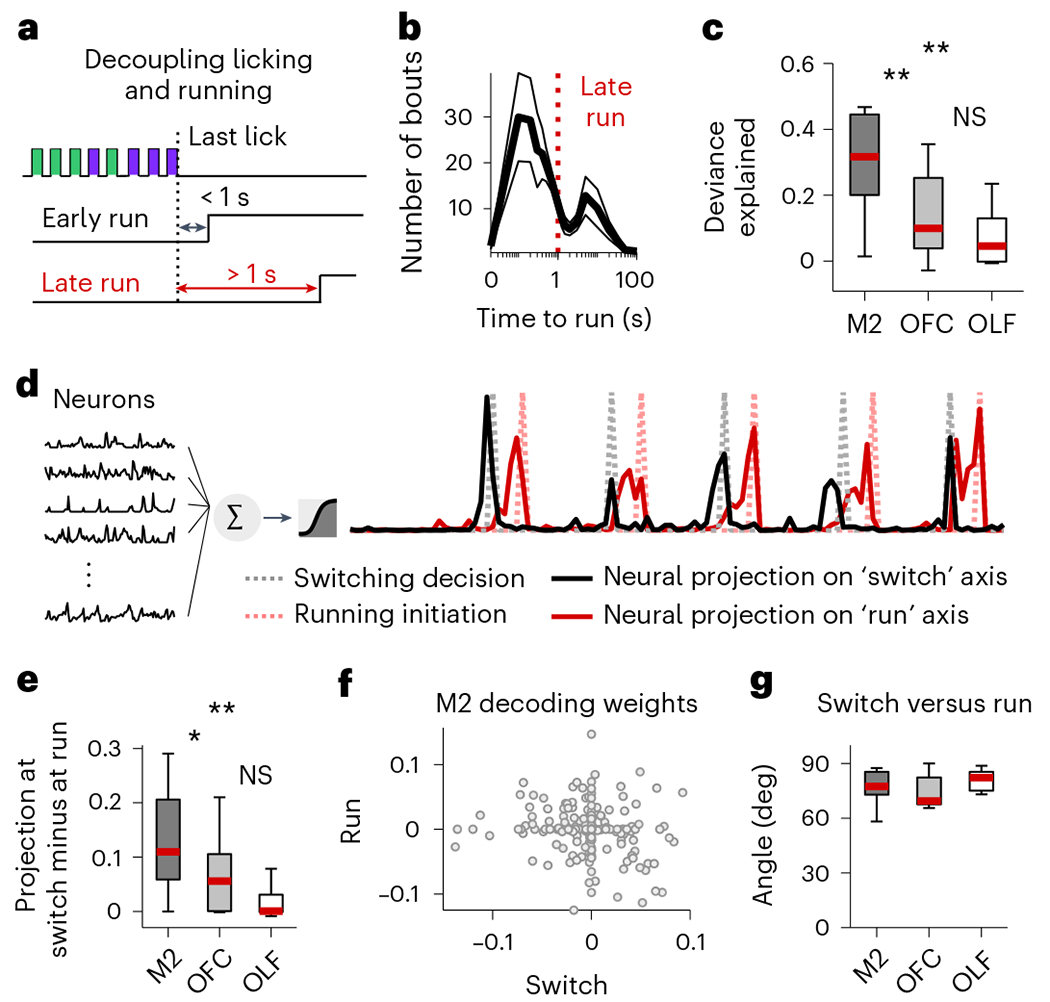
Fig. 3 |. Switching decision and running initiation are dissociable.

a, Last lick always precedes running initiation. Running initiation may occur immediately after the last lick of a bout (<1 s; ‘early run’) or mice may remain still for several seconds after the last lick and before running initiation (>1 s; ‘late run’ in red). b, Bimodal distribution of time between last lick and running initiation (mean ± s.e.m. across recording sessions). c, The deviance explained from models that predict the switching decision (last lick) from the neural activity from M2 (dark gray), OFC (light gray) and OLF (white), in ‘late run’ conditions when the last lick is fully decoupled from running initiation. Two stars indicate a significant difference between regions (two-sided Wilcoxon signed rank test, P = 0.002 between M2 and OFC; P = 0.002 between M2 and OLF). d, Illustration of the logistic regression method for predicting the switching decision (gray dash line) and the running initiation (red dash line) using neural activity from first lick to running initiation (black, left) in bouts when running occurred at least 1 s after the last lick. Red and black solid lines are examples of neural projections onto the two different axes. e, Difference in values of the neural projection onto the switch axis at the time of switching and the time of running. The larger the difference, the more dissociable the two events. Two stars indicate a significant difference between regions (two-sided Wilcoxon signed rank test, P = 0.027 between M2 and OFC; P = 0.002 between M2 and OLF; P = 0 between OFC and OLF). f, Decoding weights of each M2 neuron (gray dots) for the two different axes. g, Angles between the two different axes. In all regions, the angle is close to 90° indicating that the two axes are close to orthogonal. On each box of c, e and g, the central mark indicates the median across recording sessions (n = 11 sessions), and the bottom and top edges of the box indicate the 25th and 75th percentiles, respectively. The whiskers extend to the most extreme data points.
