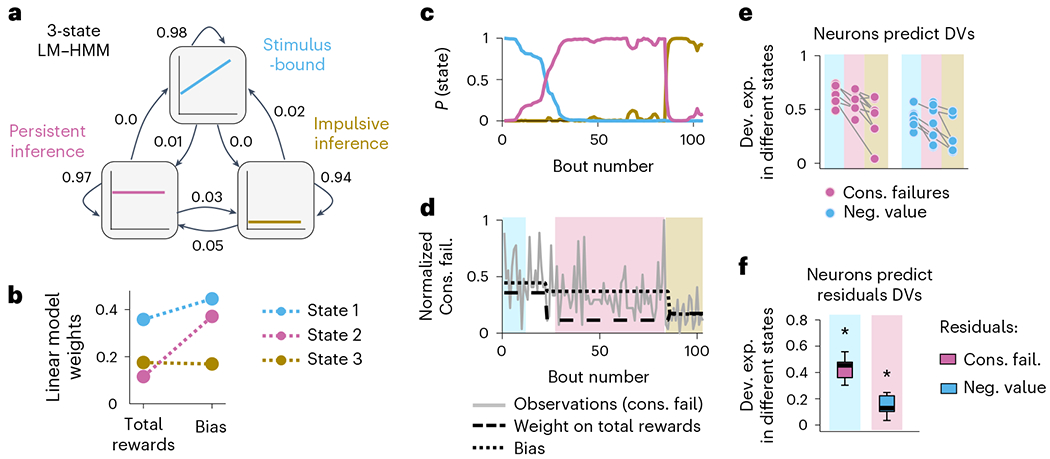
Fig. 7 |. Simultaneous representations of DVs.

a, illustration of the LM-HMM, with three different states corresponding to different decision-making strategies (labeled ‘stimulus-bound’, ‘persistent inference’ and ‘impulsive inference’). The high self-transition probabilities of 0.94, 0.97 and 0.98 indicate that states typically persist for many consecutive bouts. The transition probabilities are indicated by the arrows between states. b, LM weights for the three-state model fit to all sessions simultaneously. c, Posterior state probabilities (computed with Gaussian prior on the weights and Dirichlet prior on transition probabilities) for an example session showing that states typically persisted for many consecutive bouts with high model confidence but transitioned once or twice over the course of a session. d, Behavioral data and model parameters of the example session. The gray line indicates the number of consecutive failures (that is, observations of LMs). The shaded color background indicates the high confidence state (P (state) > 0.75). Dash black lines indicate the LMs bias and weights in each state. e, Deviance explained from models that fit M2 neurons to the DVs (pink dots, consecutive failures; blue dots, negative value) in different states (high model confidence, indicated by the color background). High confidence intervals were defined as P (state) > 0.75 for at least 25 consecutive bouts. Each dot is a recording session. Comparisons between pairs of states were made with two-sided Wilcoxon rank sum test (P > 0.05 for all comparisons). f, Deviance explained across sessions (n = 11 sessions, median ± 25th and 75th percentiles, the whiskers extend to the most extreme data points) from models that fit M2 neurons to the residual DVs in their respective alternate states of high certainty. Left is the residual consecutive failures (the signal that is orthogonal to the negative value DV) in the stimulus-bound state. Right is the residual negative value (the signal that is orthogonal to the consecutive failure DV) in the inference-based states. Stars indicate that the deviance explained is significantly different from zero (two-sided Wilcoxon rank sum test; left, P = 0.031; right, P = 0.016).
