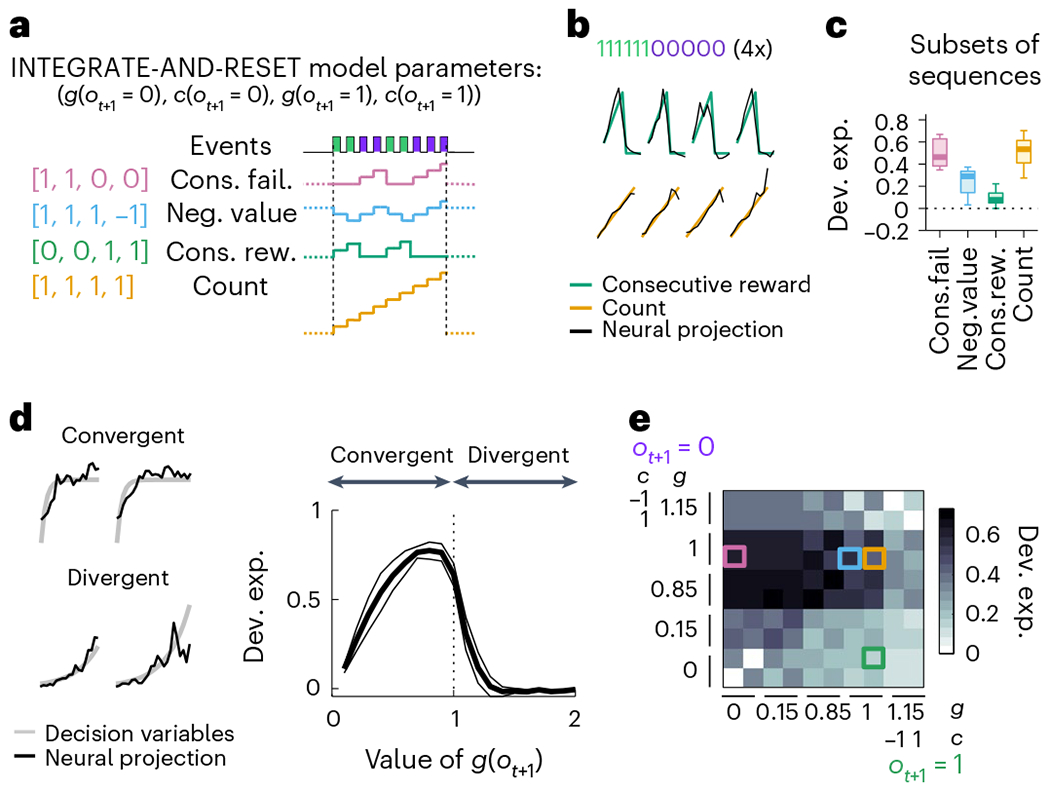
Fig. 8 |. M2 represents foraging algorithms.

a, The INTEGRATE-AND-RESET model with four parameters generates different time series by accumulating, resetting or ignoring each possible event (reward or failure). In the simplest instantiation of this model, the two outcome-dependent parameters are discrete: one is a gain factor (g) that specifies whether the running count should be reset or accumulated by each outcome–a nonlinear operation–and the other (c) specifies how each outcome linearly contributes to the resulting running count, which in general could be positive, negative or zero (leaving it unaffected; see Methods for more details). Each specification of these two discrete parameters leads to a different DV example set of parameters yielding example DVs on the right. b, Four example bouts (columns) of population activity (black traces) projected onto the dimensions that best predict the trajectory of the ‘consecutive rewards’ (green) and ‘count’ (yellow). Only subsequences of consecutive rewards followed by consecutive failures were selected to highlight the computations underlying the different variables. c, Deviance explained across sessions (n = 11 sessions, median ± 25th and 75th percentiles, the whiskers extend to the most extreme data points) of the four basis sequences decoded from M2 population activity. The sequences were decorrelated using the same method as in Fig. 6c,d. Two-sided Wilcoxon signed rank test: P = 0.002 for ‘consecutive reward’ and P = 0.00098 for ‘count’. d, Left, example sequences (gray) produced by analog parameters (convergent: c(ot+1 = 0) = c(ot+1 = 1) = 1 and g(ot+1 = 0) = g(ot+1 = 1) = 0.5; divergent: c(ot+1 = 0) = c(ot+1 = 1) = 1 and g(ot+1 = 0) = g(ot+1 = 1) = 1.15). Black traces are the neural projection from M2 population activity. Right, deviance explained from decoding convergent and divergent integrations by M2 population activity (n = 11 sessions, median ± MAD). Here we show an example where the parameters of the INTEGRATE-AND-RESET model are as follows: c(ot+1 = 0) = c(ot+1 = 1) = 1 and g(ot+1 = 0) = g(ot+1 = 1). e, Matrix of deviance explained from decoding sequences with different time constants (corresponding to different values of g) of integrations of rewards (columns) and failures (rows) with M2 population activity. The basis sequences are indicated by the color-coded squares.
