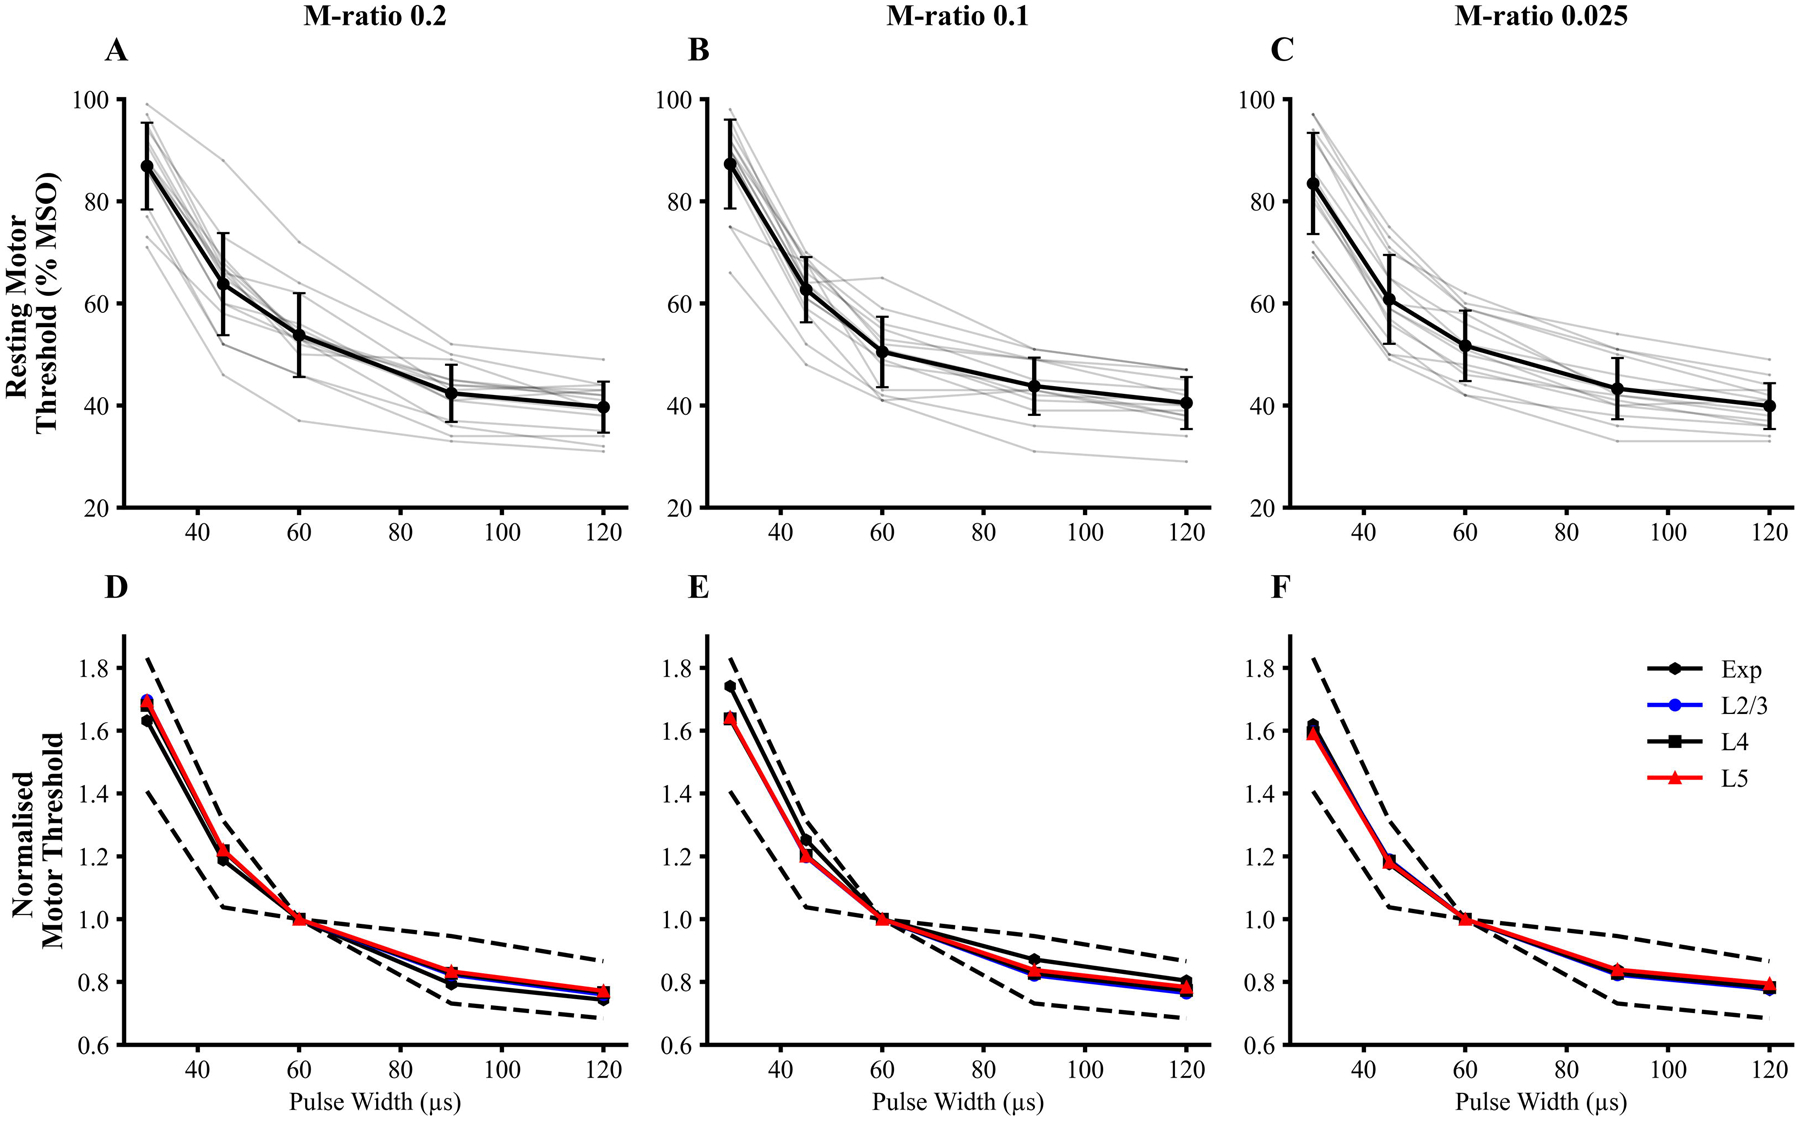
Figure 2:

(A-C) Strength-duration curves for each M-ratio. Mean (black) and individual (light grey) experimental strength-duration curve are depicted for the three M-ratio pulse shapes. The stimulus strength is reflected by the resting motor threshold (RMT) (% maximum stimulator output, MSO). (D-F) Simulated strength-duration curves for pyramidal neurons from layers 2/3 (L2/3) and layer 5 (L5) and inhibitory neurons from layer 4 (L4) were normalised to the respective threshold at pulse width 60 μs. The 95% confidence interval of the experimental data is depicted by black dashed lines. The medians of individual simulated cell strength-duration curves are presented. The experimental and simulated curves showed similar dependencies on PW and M-ratio.
