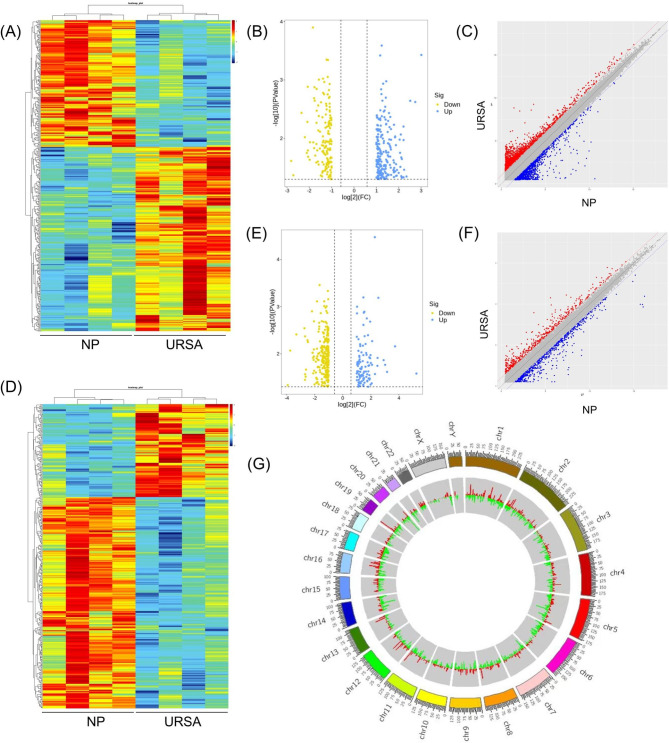
Fig. 2.
The altered lncRNA and mRNA expression profiles of placental villus inpatients with URSA. (A) The cluster analysis (heatmaps) of differentially expressed lncRNAs (dif-lncRNAs). (B) The volcano plots of dif-lncRNAs. (C) The scatter plots of dif-lncRNAs. (D) The cluster analysis (heatmaps) of differentially expressed mRNAs (dif-mRNAs). Red and blue indicate up- and downregulation, respectively. (E) The volcano plots of dif-mRNAs. (F) The scatter plots of dif-mRNAs. Red and blue indicate up- and downregulation, respectively. (G) The circos describing the landscape of significantly altered DELs on human chromosomes

