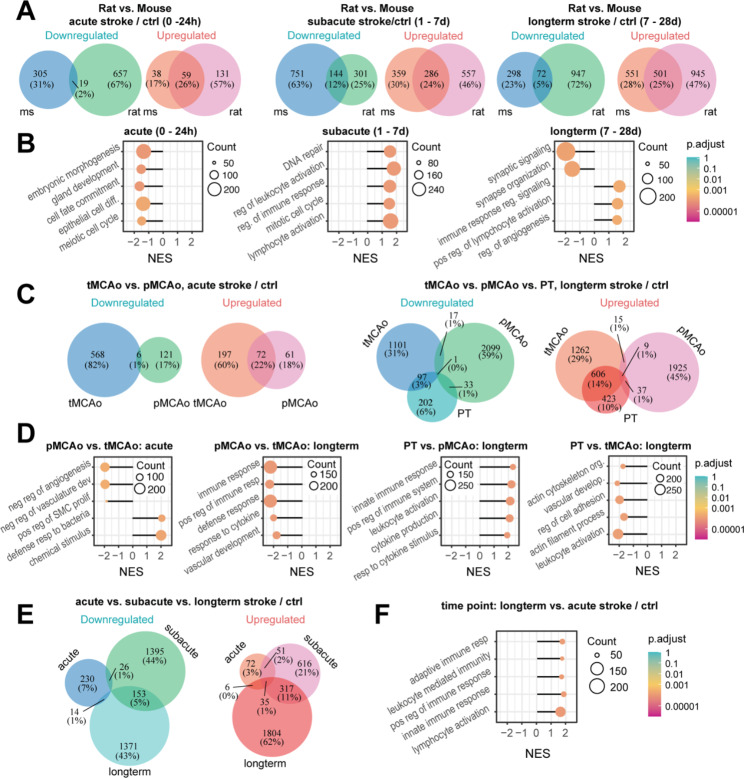
Fig. 2.
Gene expression profiles after stroke differ across species. (A) Venn Diagram representing number of shared and differentially expressed genes between mice and rats to different time points. (B) Gene ontology analysis of a subset of most significantly enriched biological processes in rats and mice. (C) Venn Diagram representing number of shared and differentially expressed genes between permanent MCAo and transient MCAo and the photothrombotic stroke model at different time points. (D) Gene ontology analysis of a subset of most significantly enriched biological processes in different stroke models. (E) Venn Diagram representing number of shared and differentially expressed genes between different time periods after stroke. (F) Gene ontology analysis of a subset of most significantly enriched biological processes at different time points

