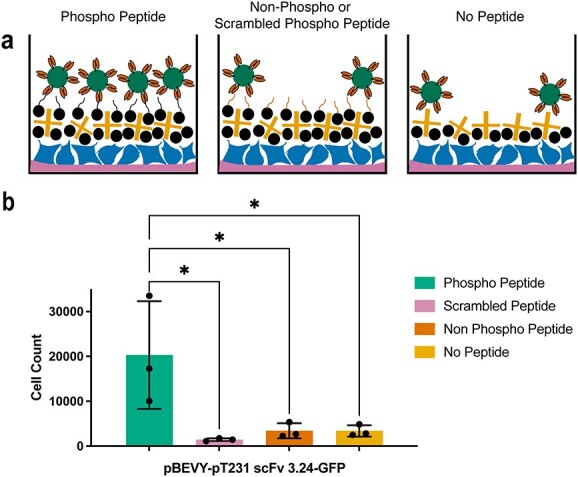
Fig. 2.

Testing selective biopanning of the scFv to peptide of interest. (a) Schematic representation showing different control conditions tested. Wells with target peptide (topmost image) are expected to contain more yeast cell reporters than wells with non-target peptide (middle image) and wells without peptide (bottom image). (b) Quantification of yeast cells expressing pT231 scFv 3.24 and GFP present in wells after washing. Each datapoint indicates average of values measured from three biological replicates in two to three separate experiments. Error bars indicate standard deviation of the datapoints. *P ≤ 0.05 using Tukey’s multiple comparisons test.
