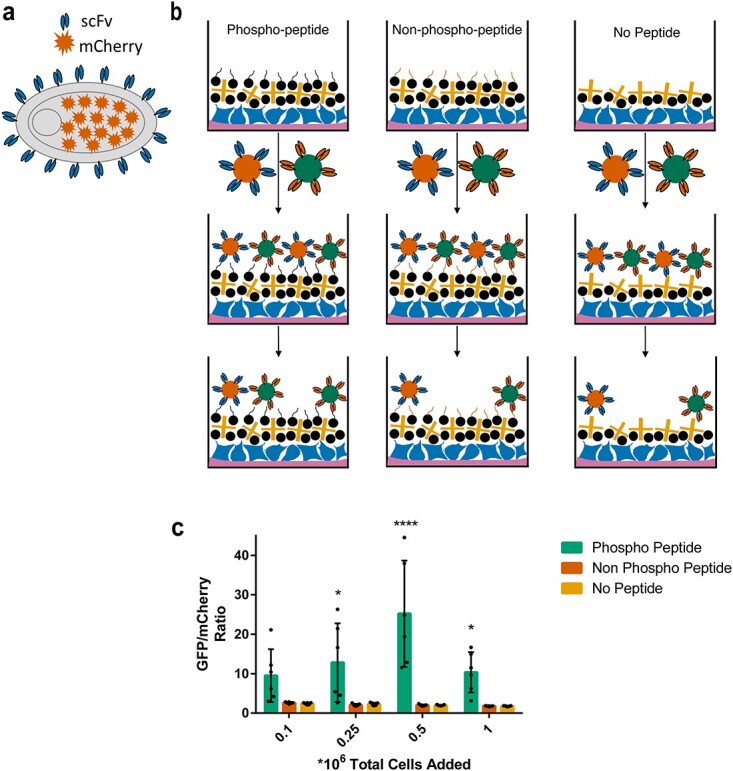
Fig. 3.

Design and application of internal control yeast cell reporters in biopanning. (a) Schematic representation (of control yeast cell design. Yeast cells display a control scFv on their surface and intracellularly express a fluorescent protein (mCherry). (b) Schematic representation of biopanning method with control yeast cells included. Yeast cells expressing pBEVY-4420-mCherry and pBEVY-pT231 scFv 3.24-GFP are mixed in equal ratio and added to wells containing phospho-peptide (left), non-phospho-peptide (middle) and no peptide (right). (c) Quantification of the ratio of yeast cells expressing pBEVY-pT231 scFv 3.24-GFP to yeast cells expressing pBEVY-4420-mCherry present in wells after washing. Each datapoint indicates a ratio measured from a biological replicate. Each condition was repeated in two separate experiments with three biological replicates (6 datapoints per condition). Error bars indicate standard deviation of the datapoints. *P ≤ 0.05, ****P ≤ 0.0001 using Tukey’s multiple comparisons test. Otherwise, P > 0.05.
