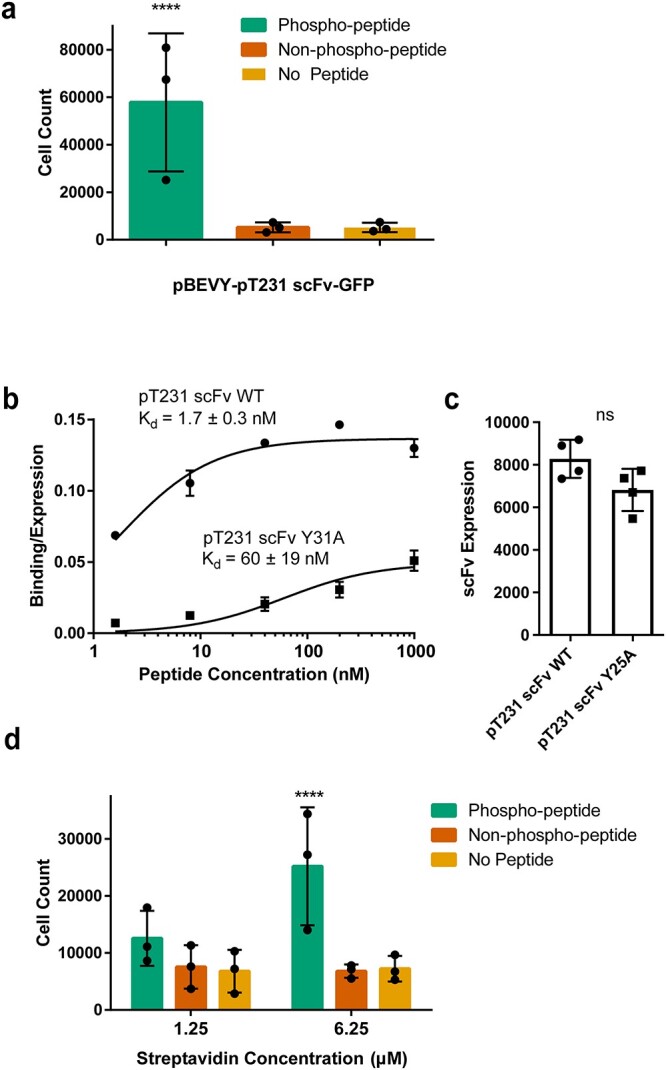
Fig. 5.

Testing selective binding for lower affinity scFvs to peptide of interest after optimizing parameters. (a) Quantification of number of yeast cells expressing pBEVY-pT231 scFv-GFP present in wells after biopanning with a biotin concentration of 125 μM, a peptide concentration of 0.1 μM and a streptavidin concentration of 1.25 μM. Each datapoint indicates the value measured from three biological replicates in an experiment (3 separate experiments). Error bars indicate standard deviation of the datapoints. (b) Binding/expression curve for wild-type scFv (pCT-4RE-pT231 scFv) and lower affinity mutant (pCT-4RE-pT231 scFv Y31A) measured using flow cytometry. Each datapoint indicates the average of values from two to four biological replicates. Error bars indicate standard deviation. (c) scFv expression of wild-type scFv and lower affinity mutant Y31A measured using flow cytometry. Each datapoint indicates the average of geometric means from two to four biological replicates. Error bars indicate standard deviation of the datapoints. (d) Quantification of yeast cells expressing pBEVY-pT231 scFv Y31A-GFP present in wells after biopanning. Each datapoint indicates the value measured from two biological replicates in an experiment (three separate experiments). Error bars indicate standard deviation of the datapoints. For panels (a) and (d), ****P ≤ 0.0001 using Tukey’s multiple comparisons test. Otherwise, P > 0.05. For panel (c), ns P > 0.05 using two-tailed Student’s t-test.
