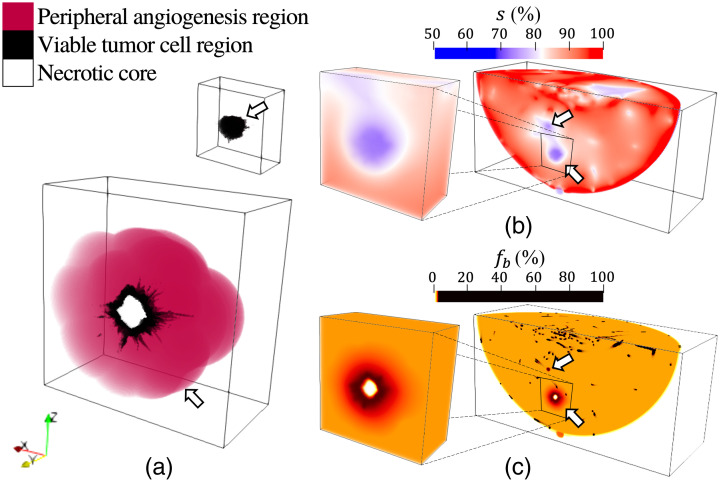
Fig. 3.
Malignant lesion model: (a) anatomical NLPs without (top) and with a necrotic core and a peripheral angiogenesis region (bottom), and distributions of (b) oxygen saturation and (c) blood volume fraction . The two lesions were inserted at physiologically plausible locations randomly selected among the candidate sites produced by the VICTRE tools. In panels (a)–(c), halves of the lesion volumes are presented to show their cross-sections. In panels (b) and (c), the partial breast volumes clipped at the -coordinate at which both lesions are exhibited are illustrated. The arrows in panel (b) indicate the simulated tumor hypoxia and those in panel (c) indicate the simulated tumor angiogenesis, necrotic tumor core, and relatively high total hemoglobin concentration of the viable tumor cells compared with healthy tissues. These are from a type A breast. Paraview40 was used for volume rendering, and color maps were adjusted for better visibility.

