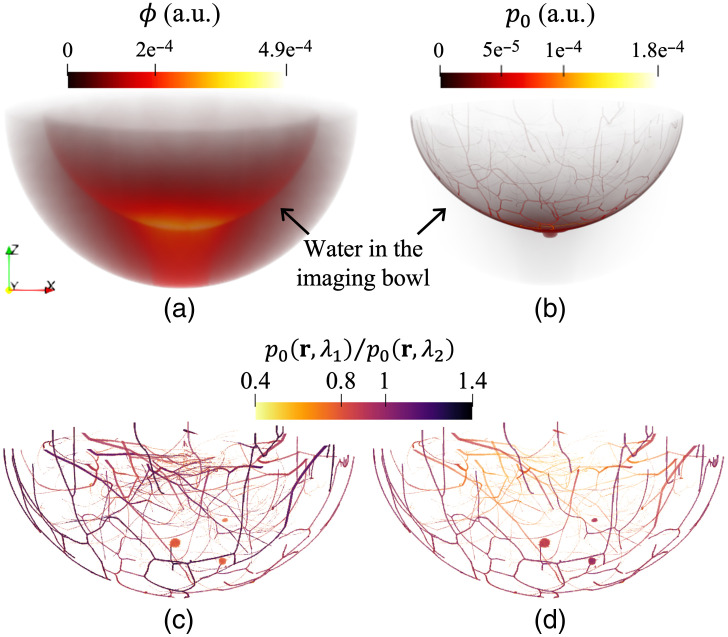
Fig. 7.
Simulated distributions of optical fluence and initial pressure : (a) and (b) of the breast in the water-filled imaging bowl at a wavelength of 800 nm, and the ratio of the breast blood vasculature and lesions between wavelengths (c) of 800 and 757 nm and (d) of 850 and 800 nm. These are from a type C breast. Paraview40 was used for volume rendering, and color maps were adjusted for better visibility.

