FIG 2.
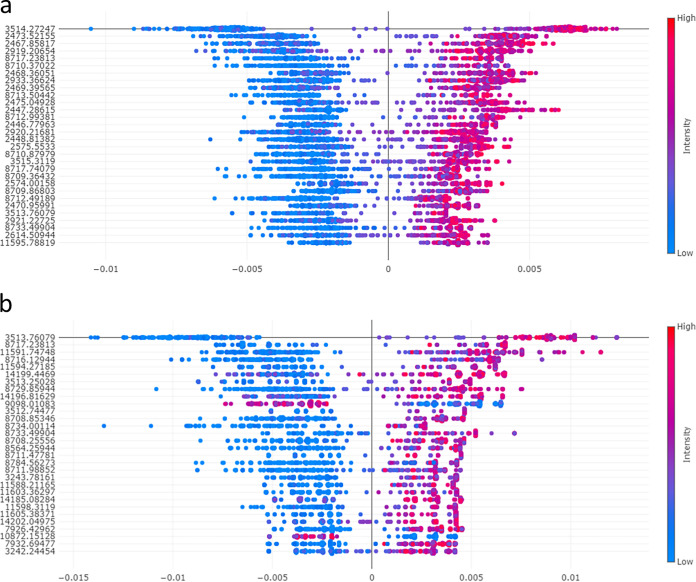
Quantification of feature impact on the RF prediction for CPK through an analysis of the Shapley values of the 30 most important features. The images represent the quantification of feature impact on the RF prediction for the (a) MLINEAR and (b) MLINEAR-3k methods for the prediction of CPK through the analysis of the Shapley values. The values on the left represent the most impactful features (m/z peak location) on the RF prediction that is the mean Shapley value. The scatterplot on the right indicates the distribution of the Shapley values and their impacts on the model output across all test isolates in the validation set. The colors of each test spectrum are represented as a dot (blue for a low feature value and red for a high feature value) to indicate the feature value (i.e., the intensity of the respective feature in the spectrum). Shifts to the right in the test spectra represented as dots indicate greater contributions of the features (m/z peak) to the category selected as positive (CPK).

