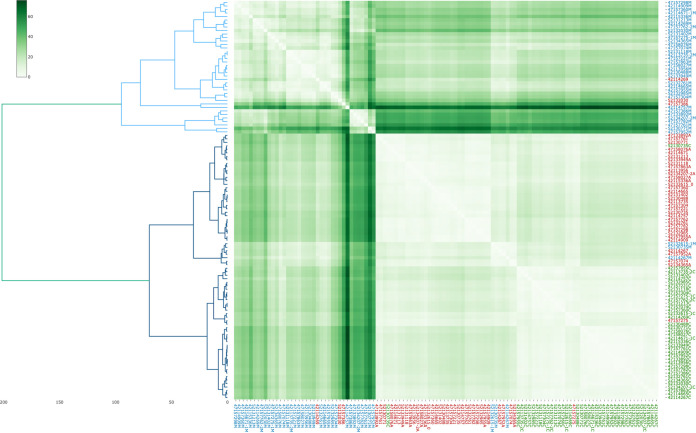
FIG 4.
Growth media impact in the bacterial proteome of K. pneumoniae. Hierarchical clustering after applying PCA with a heat map in 114 NCPK in a 0.1 threshold peak matrix. The data were scaled, and the Euclidean distance between samples expressed using a green-colored scale and Ward’s metric. Isolates for which the mass spectra were obtained prior to culture in MacConkey agar are indicated in blue. Isolates cultured on blood agar are indicated in red. Isolates cultured on chocolate agar are indicated in green. The green scale shows the distances between pairs of isolates.

