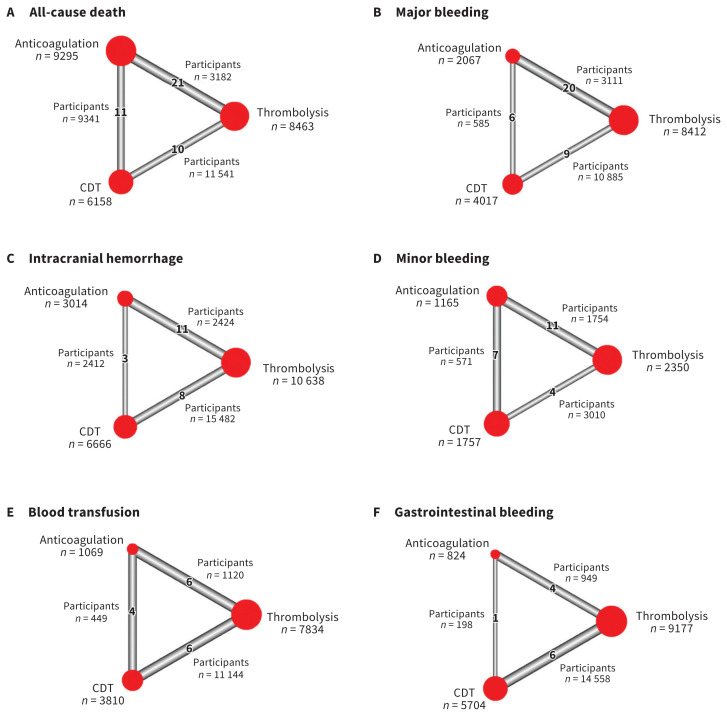
Figure 2:
Net graphs of primary and secondary outcomes, showing the number of participants included in analyses of (A) all-cause death, (B) major bleeding, (C) intracranial hemorrhage, (D) minor bleeding, (E) blood transfusion and (F) gastrointestinal bleeding. Note: CDT = catheter-directed thrombolysis. The size of the red circle and corresponding sample size indicates the number of participants who received that treatment. The number of participants along the triangle sides indicates those involved in comparison of treatment arms. The thickness of the sides in the triangle indicates how many studies were conducted between treatments. As the number of articles comparing treatments increases, the thickness increases. Some studies included 3 treatment arms.

