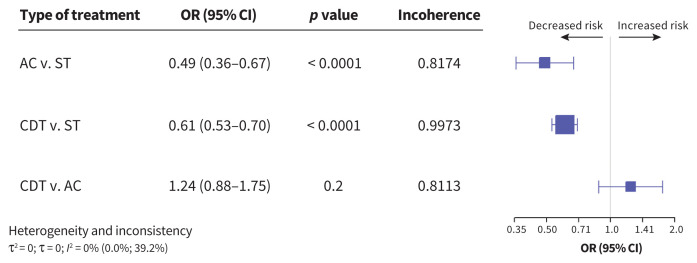
Figure 4:
Network meta-analysis of the association between treatment for pulmonary embolism and major bleeding. Size of squares is proportional to the weight of each arm. Decreased or increased risk of the outcome is of the first type of treatment in comparison, relative to the second type of treatment. The p value indicates the probability of observing the differences between direct and indirect treatment effects. The presence of incoherence is indicated by a p value less than 0.05. Note: AC = anticoagulation, CDT = catheter-directed thrombolysis, CI = confidence interval, OR = odds ratio, ST = systemic thrombolysis.

