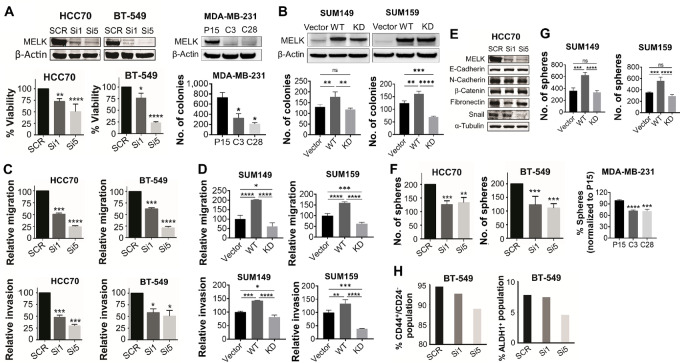
FIGURE 2.
Effect of MELK knockdown or overexpression on proliferation, motility, EMT, and CSC properties in TNBC cells. Effect of MELK knockdown or KO (A) or overexpression (B) on proliferation and anchorage-independent growth of TNBC cells. HCC70 and BT-549 cells (A, bottom left) were treated with two different siMELK sequences for 48 hours. MELK expression was then determined using Western blot analysis (top), and cell viability was determined using trypan blue exclusion assay (bottom left). In MELK KO MDA-MB-231 cells (A, bottom right), anchorage-independent growth was determined using soft-agar assay at week 3 following incubation. β-Actin was used as a loading control for Western blot analysis. SUM149 and SUM159 cells (B) were transfected with plasmids encoding WT MELK gene or KD MELK gene and cultured for 48 hours. MELK expression was then determined using Western blot analysis (top), and cell growth was determined using anchorage-independent growth assay (bottom). β-Actin was used as a loading control for Western blot analysis. Effect of MELK knockdown (C) or overexpression (D) on migration and invasion of TNBC cells. Cells were transfected with two different siMELK sequences for 72 hours or plasmids encoding WT MELK gene or KD MELK gene for 48 hours and then assayed for migration and invasion. E, Effect of MELK knockdown on expression of EMT epithelial and mesenchymal markers in TNBC cells. Cells were treated with two different siMELK sequences for 48 hours, and then MELK expression was determined using Western blot analysis. α-Tubulin was used as a loading control. Effect of knockdown or KO (F) or overexpression (G) of MELK on mammosphere formation in TNBC cells. Cells were transfected with two different siMELK sequences or plasmids encoding WT MELK gene or KD MELK gene and 48 hours later were seeded for mammosphere formation. MELK KO clones were cultured for 7 days and then analyzed for mammosphere formation. H, Effect of MELK knockdown on CD44+/CD24− and ALDH1+ subpopulations in TNBC cells. Cells were treated with two different siMELK sequences and 48 hours later subjected to flow cytometry analysis. In A and F, P15 indicates Cas9-p15 control cells; C3, MELK KO C3 clones; and C28, MELK KO C28 clones. In A–D, G, and F, data are presented as mean ± standard deviation. *, P < 0.05; **, P < 0.01; ***, P < 0.001; ****, P < 0.0001.

