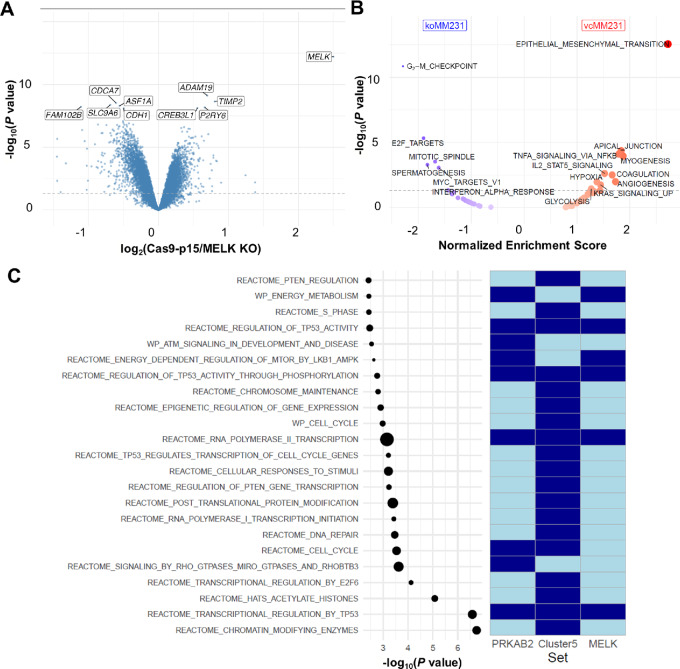
FIGURE 5.
Differential gene expression profile, consolidated gene set enrichment, and network analyses. A, Differences in gene expression are shown in volcano plot format, where the X-axis denotes the log2-transformed fold-change and the Y-axis denotes the –log10-transformed P value. The log2 fold-change was calculated as Cas9-p15 control cell fold-change/MELK KO MDA-MB-231 cell fold-change, resulting in positive values for genes overexpressed in the WT condition and negative values for genes overexpressed in the KO condition. The nominal P value threshold at 5% is indicated by a dashed blue horizontal line. The 10 most differentially expressed genes by P value are labeled using their gene symbol. B, Differences in the hallmark enrichment pattern are shown in a modified volcano plot format, where the X-axis denotes the normalized enrichment score and the Y-axis denotes the –log10-transformed P value. The normalized enrichment score was calculated as Cas9-p15 control cell score/MELK KO MDA-MB-231 cell score, resulting in positive values for hallmarks enriched in the WT condition and negative values for hallmarks enriched in the KO condition, as indicated at the top of the plot. The nominal P value threshold at 5% is indicated by a dashed blue horizontal line. Significant hallmarks are labeled using their gene set name. C, Pathway enrichment profile of the MELK-centered PPI network. In the left part of the plot, significantly enriched pathways, listed along the Y-axis, are represented in dot plot format; the X-axis represents the –log10-transformed P value; and the size of the dots reflects the number of pathway genes contained in the network. To the right of the dot plot, overlaps between enriched pathways and three gene sets defined after analyzing the MELK-centered protein–protein interaction network are indicated in heat map format. The gene sets of interest are indicated in the X-axis underneath the heat map, where dark blue denotes the presence of pathway genes and light blue denotes the absence of pathway genes in these gene sets.

