
Fig. 4.
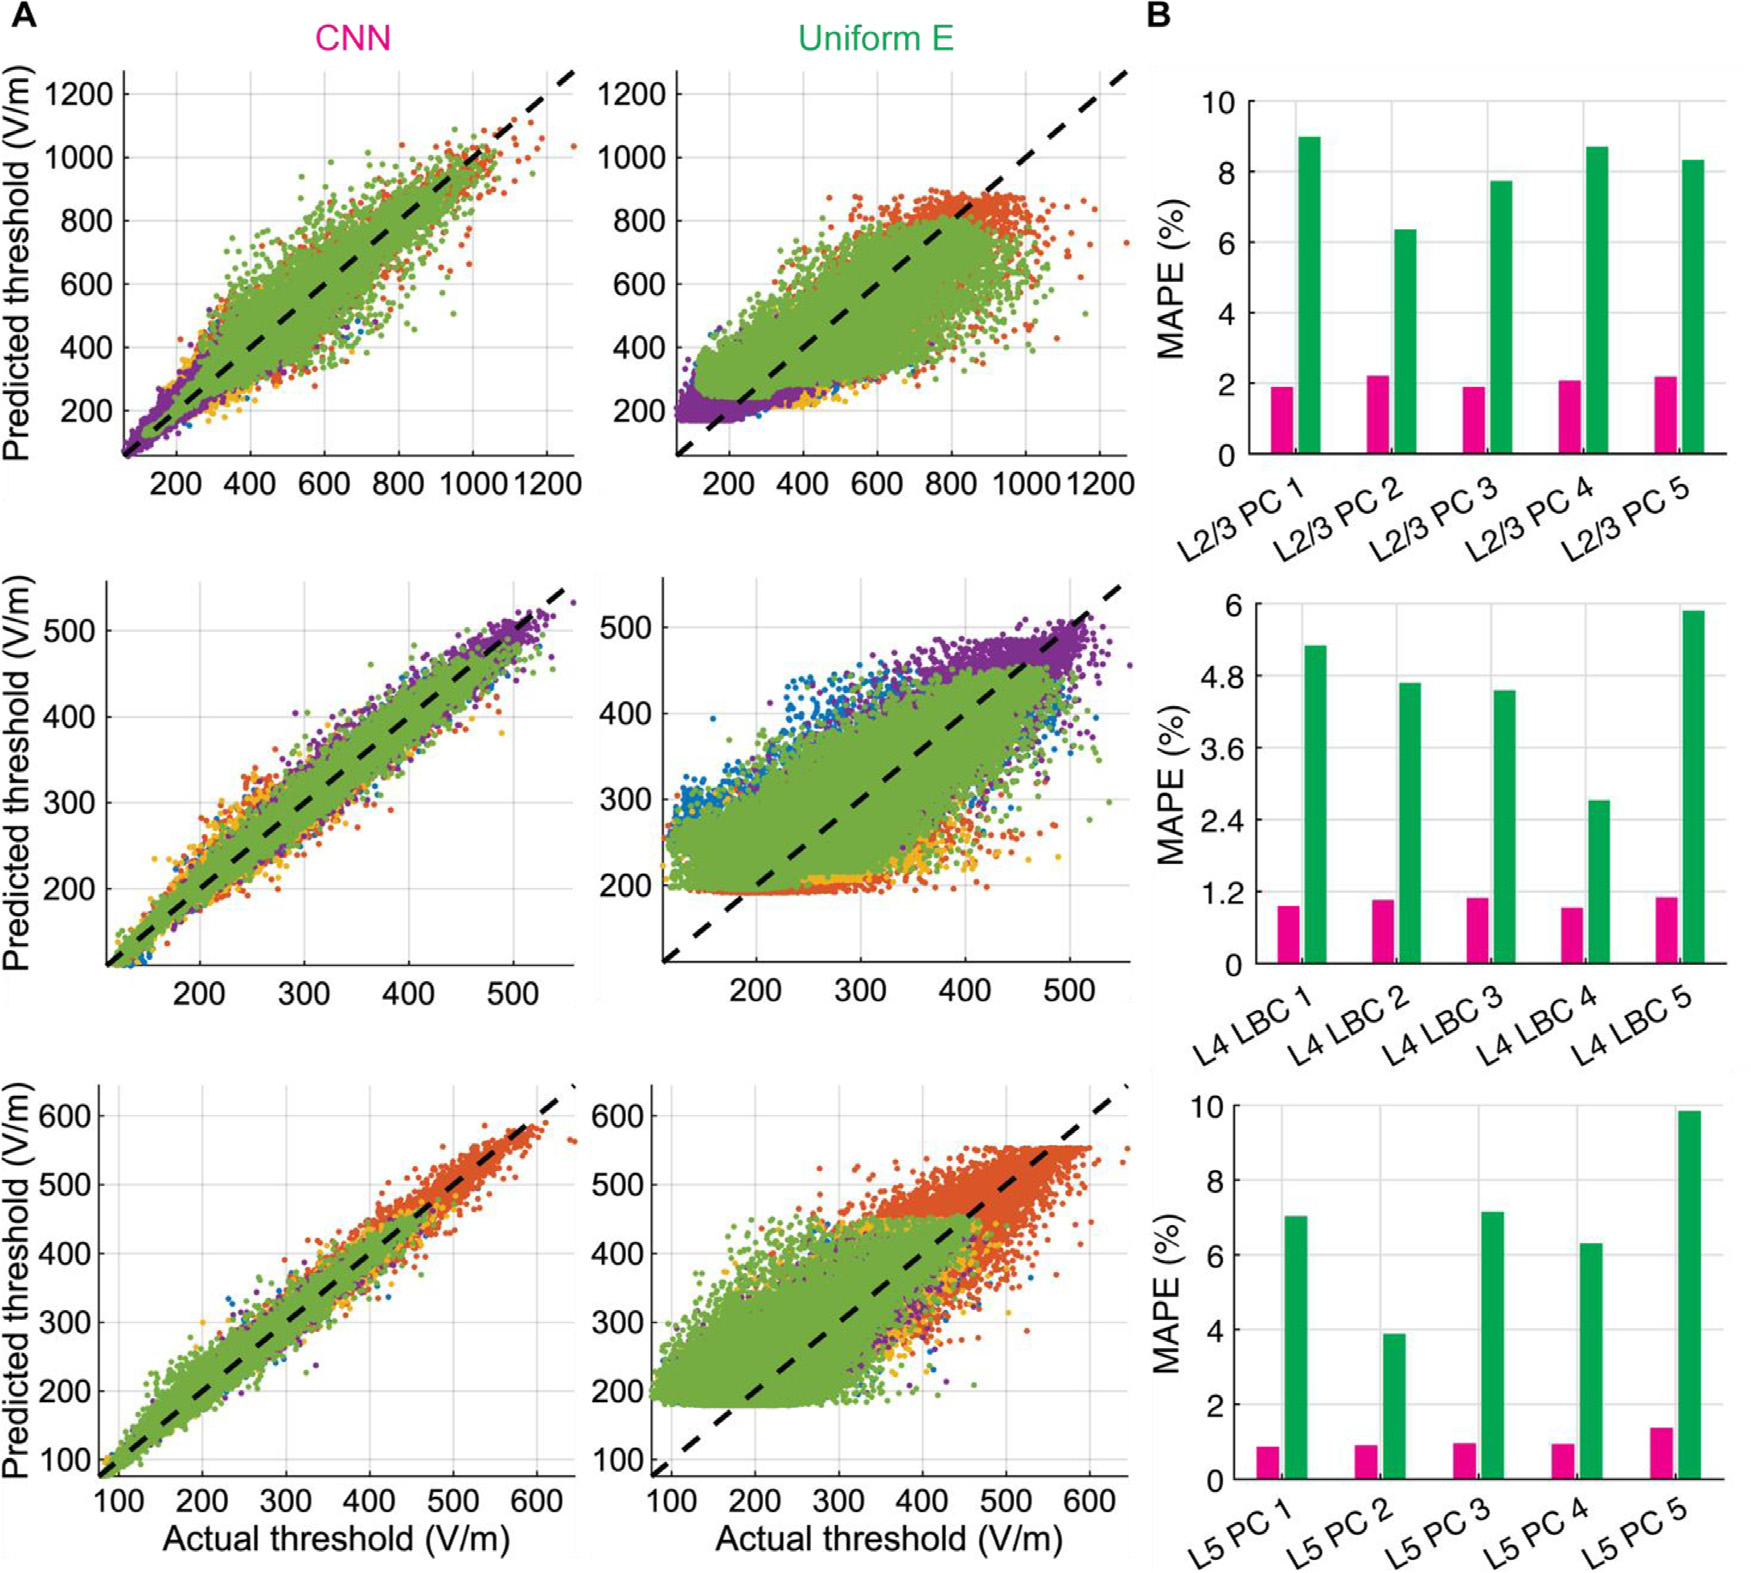
Distribution of threshold E-field errors for CNN and uniform E-field approximation. (A) Predicted thresholds by CNN (left column) and uniform E-field approximation (middle column) across entire test dataset plotted against thresholds from NEURON simulations (actual) in magnitude of E-field at soma for L2/3 PCs (top row), L4 LBCs (middle row), and L5 PCs (bottom row). Different colors correspond to different clones within layer. (B) Mean absolute percent error (MAPE) on test dataset for CNN (magenta) and uniform E-field approach (green), separated by clone within layer.