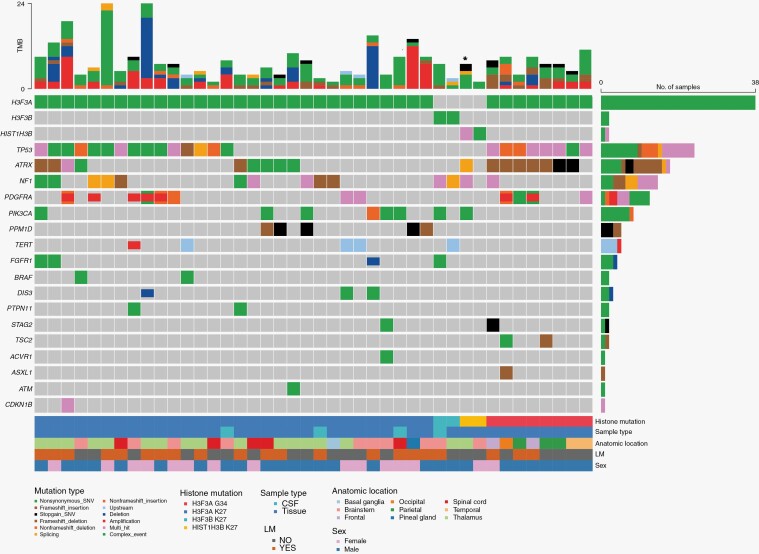
Figure 1.
Oncoplot detailing next-generation sequencing results and clinicopathological characteristics of all 42 patients, organized by histone mutation. Copy number variations are represented by coloring of the middle portion of the square (deletions in red, amplifications in blue). For patients with both CSF and tissue NGS available, tissue results are included here; for 4 patients only CSF NGS was available. *Denotes patient with both K27 and G34 mutations.

