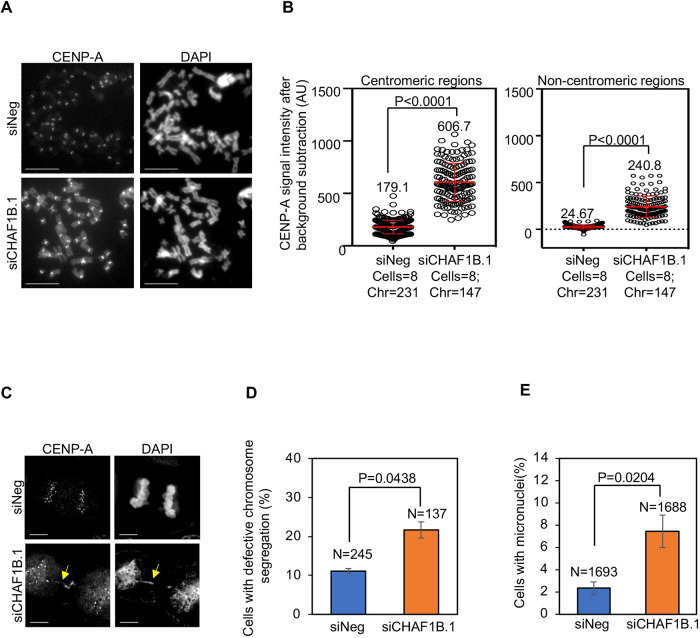
Fig. 3.
CHAF1B prevents the mislocalization of CENP-A to non-centromeric regions and CIN phenotypes. (A) Representative images of metaphase chromosome spreads showing the localization of CENP-A at centromeric and non-centromeric regions in HeLaCENP-A–TAP cells transfected with the indicated siRNAs. Metaphase chromosome spreads were prepared 72 h post transfection, and cells were immunostained using an antibody against CENP-A and stained with DAPI. Scale bars: 5 µm. (B) Quantification of CENP-A signal intensities at centromeric (left) and non-centromeric (right) regions in metaphase chromosome spreads of HeLaCENP-A–TAP cells transfected with the indicated siRNAs. Each circle represents a spot on a centromeric or non-centromeric region. ‘Cells’ and ‘Chr’ denote the numbers of cells and chromosomes analyzed, respectively. The red lines indicate mean±s.d. for YFP signal intensities across areas measured in the number of cells indicated from three independent experiments. A.U., arbitrary units. (C) Representative images showing chromosome segregation status in HeLaCENP-A–TAP cells transfected with the indicated siRNAs. The yellow arrow indicates lagging chromosomes. Scale bars: 5 µm. (D,E) The proportion of cells exhibiting defective chromosome segregation (D) and cells with micronuclei (E) in HeLaCENP-A–TAP cells transfected with the indicated siRNAs. N denotes the number of cells analyzed. Error bars represent the s.e.m. from three independent experiments. P-values shown in B,D,E were calculated using unpaired, two-tailed t-test.

