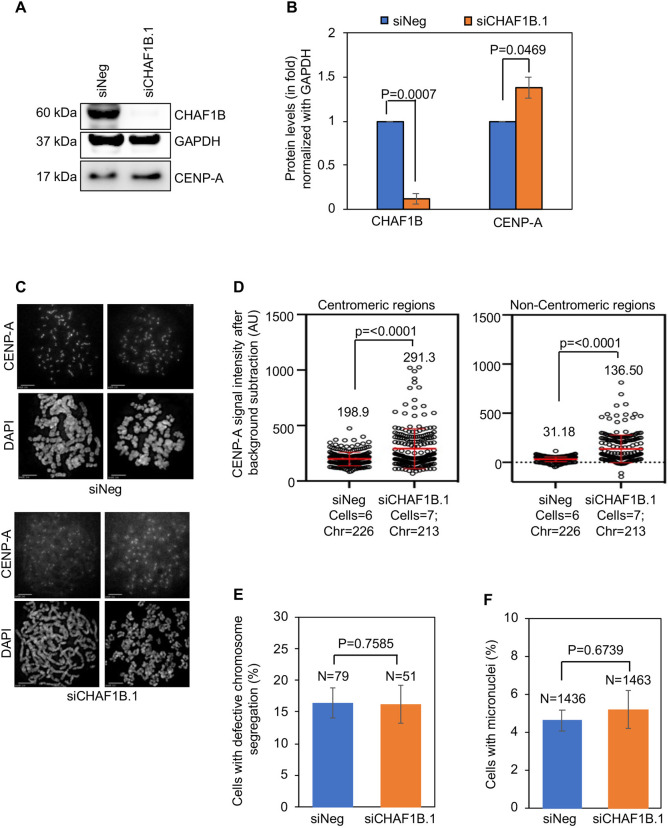
Fig. 4.
Endogenous CENP-A is mislocalized to non-centromeric regions in parental HeLa cells depleted of CHAF1B. (A) Western blots of lysates prepared from parental HeLa cells transfected with the indicated siRNAs for 72 h and analyzed using antibodies as indicated. (B) Quantification of CHAF1B and endogenous CENP-A levels in whole-cell extracts of parental HeLa cells transfected with the indicated siRNAs. The protein levels were normalized against those of GAPDH and expressed as fold increase or decrease relative to those of control cells. (C) Representative images of metaphase chromosome spreads showing the localization of CENP-A at centromeric and non-centromeric regions in parental HeLa cells transfected with the indicated siRNAs. Metaphase chromosome spreads were prepared 72 h post transfection, and cells were immunostained with an antibody against CENP-A and stained with DAPI. Scale bars: 5 µm. (D) Quantification of CENP-A signal intensities at centromeric (left) and non-centromeric (right) regions in metaphase chromosome spreads of parental HeLa cells transfected with the indicated siRNAs. Each circle represents a spot on a centromeric or non-centromeric region. ‘Cells’ and ‘Chr’ denote the numbers of cells and chromosomes analyzed, respectively. Red lines indicated mean±s.d. for YFP signal intensities across areas measured in the number of cells indicated from two independent experiments. (E,F) The proportion of cells exhibiting defective chromosome segregation (E) and cells with micronuclei (F) in parental HeLa cells transfected with the indicated siRNAs. N denotes the number of cells analyzed. Error bars in B,E,F represent s.e.m. from four (B) and three (E,F) independent experiments. P-values shown in B,D–F were calculated using unpaired, two-tailed t-test in GraphPad Prism 9.

