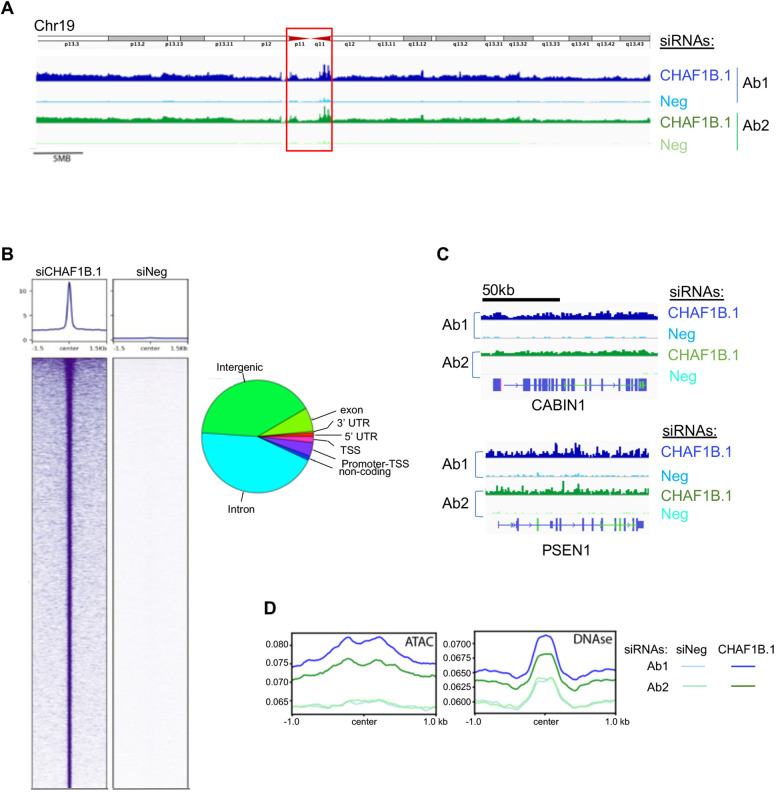
Fig. 5.
Genome-wide analysis of CUT&RUN sequencing shows the mislocalization of CENP-A upon depletion of CHAF1B in HeLaCENP-A–TAP cells. (A) CUT&RUN sequencing of TAP-tagged CENP-A showing the distribution of CENP-A across chromosome 19 (CHM13v2) in asynchronous HeLaCENP-A–TAP cells transfected with the indicated siRNAs for 72 h. The analysis was performed using two different antibodies against CENP-A. An ideogram of chromosome 19 is shown above the CUT&RUN sequencing tracks and the red box indicates the endogenous centromere. (B) Peaks of CENP-A identified by CUT&RUN sequencing in CHAF1B-depleted cells are shown relative to those of siNeg-transfected control cells. The pie chart shows the distribution of CENP-A peaks across various genomic regions. TSS, transcription start site; UTR, untranslated region. (C) Representative distributions of CENP-A at the gene level are shown for two genes: PSEN1 (Chr14) and CABIN1 (Chr22). (D) Overlap of CENP-A CUT&RUN profile from HeLaCENP-A–TAP cells transfected with the indicated siRNAs plotted against previously identified ATAC-seq peaks (GSM2830382; Cho et al., 2018) and DNase I-hypersensitive sites (GSM763533; Mercer et al., 2013).

